Hi, I have this code and I would like to add a line with the standar deviation to my ggplot
example <- data.frame (var1 = c ("ESP", "AUT", "POR", "GRE", "ITA", "USA", "FRA", "GER", "DEN", "BRA", "AUS", "NZ", "CHI","JAP"),
var2 = c(91, 29, 83, 49, 58, 68, 77, 88, 90, 34, 10, 91, 50, 46),
var3 = c (1, 0, 1, 1, 1, 1, 1, 1, 1, 0, 1, 0, 0, 0),
var4 = c("EUR","EUR","EUR","EUR","EUR","AME", "EUR", "EUR", "EUR","AME", "OCE","OCE", "ASI", "ASI"))
example %>%
group_by(var4) %>%
summarise(mean_var2 = mean(var2),
sd_var2 = sd(var2)) %>%
ggplot(aes(x = var4, y = mean_var2))+
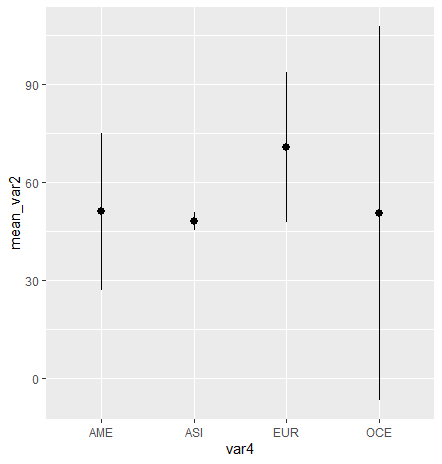
geom_point()
Now I am getting this

I would like to add sd_var2 to the points in each continent. It would be great if I could keep using the pipes and the group_by and summarize code.