Hello,
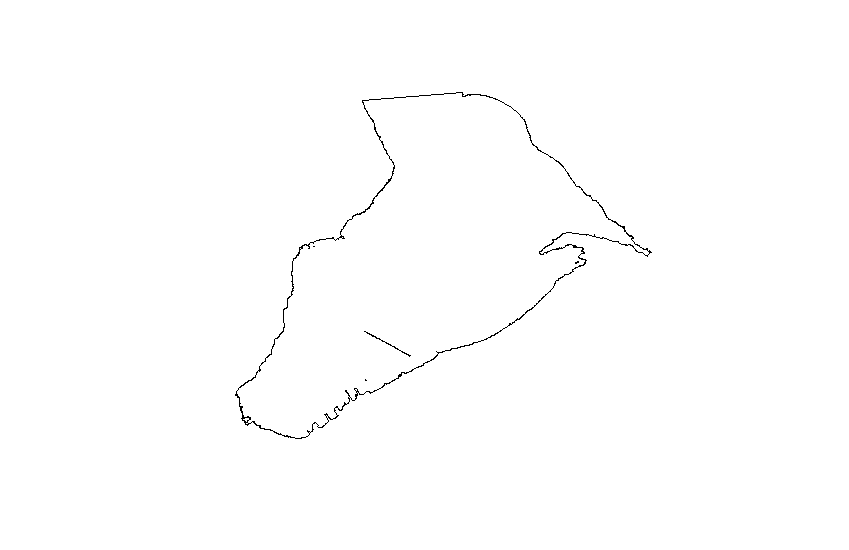
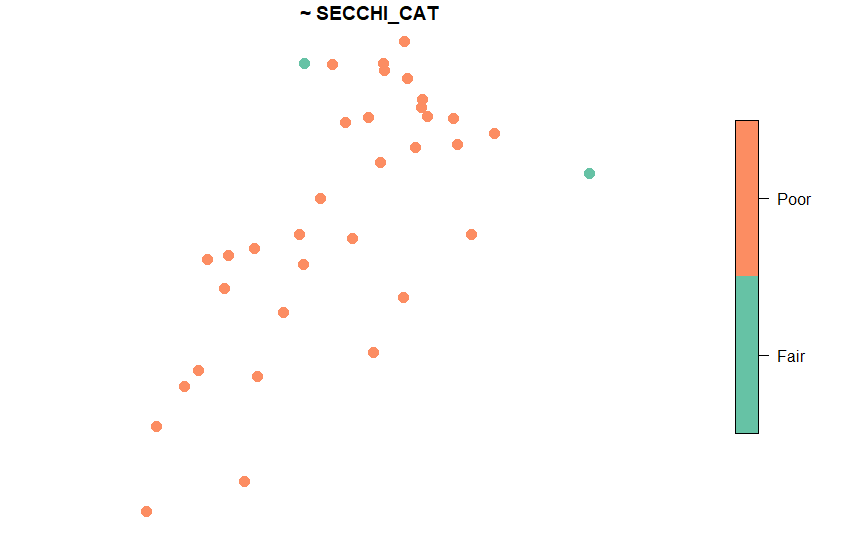
I have spatial data plotted using sp_plot() from the R package spsurvey. I want to add a shapefile that shows the shoreline around the sp_plot that I've converted into an sf around the spatial data using the following code.
shp <- read_sf(dsn = ".", layer = "NCCA_GL_2020_Frame_4_14_21")
cb <- filter(shp, LAKEREG_20 == "Chequamegon Bay")
cb1 <- st_transform(cb, crs=4326)
Basically, I want to add this sf:
To this plot:
I tried this:
sp_plot(sf.cat, formula = ~ SECCHI_CAT, key.width = lcm(3), cex = 1.5, pch = 19) +
plot(st_geometry(cb1))
But I only get the second plot generated by plot() and the following error:
Error in sp_plot(sf.cat, formula = ~SECCHI_CAT, key.width = lcm(3), cex = 1.5,  :
  non-numeric argument to binary operator
The CRS is in the same projection as the sp_plot. However, the dimensions are different and the bounding boxes are also different, and I don't know if that's the problem. Or if I'm trying to combine two plots that are not using the same plotting package.
> head(sf.cat)
Simple feature collection with 6 features and 11 fields
Geometry type: POINT
Dimension:     XY
Bounding box:  xmin: -90.9319 ymin: 46.5869 xmax: -90.7886 ymax: 46.7204
Geodetic CRS:  WGS 84
> head(cb1)
Simple feature collection with 1 feature and 8 fields
Geometry type: MULTIPOLYGON
Dimension:     XYZ
Bounding box:  xmin: -90.95088 ymin: 46.58252 xmax: -90.69222 ymax: 46.73004
z_range:       zmin: 0 zmax: 0
Geodetic CRS:  WGS 84
If anyone has any ideas or advice, that would be most welcome.
Thank you SO much!

