Add second facet grid or second discrete y-axis

Hi all,

Suppose I have this dataframe:

df2 <- data.frame(tissue = c("Blood", "Nerve", "Stomach", "Liver", "Blood", "Kidney"),
                  qtl = c("e", "s", "e", "e", "s", "s"),
                  gene = c("gene1", "gene1", 
                           "gene2", "gene2",
                           "gene3", "gene4"),
                  value = c(0.4, 0.2, 0.1, 0.9, 0.5, 0.3),
                  second_label = c("label1", "label1", "label1","label1",
                                  "label2", "label2"))

And plot it as such:

ggplot(df2, 
       aes(x=tissue, y=qtl,
           size=value))+
  geom_point()+
  facet_grid(rows = vars(gene),
             scales = "free", 
             space='free',
             switch = "y")+
  theme(axis.title.x = element_blank(),
        axis.text.x = element_text(size=8,angle = 90, hjust=1, vjust=0.2),
        axis.title.y = element_blank(),
        axis.text.y = element_text(size=8),
        axis.ticks.y = element_blank(),
        axis.line = element_line(color = "black"),
        strip.text.y.left = element_text(size = 8, angle=0),
        strip.background = element_blank(),
        panel.spacing.y = unit(0.5, "lines"),
        strip.placement = "outside",
        panel.background = element_blank(),
        panel.grid.major = element_line(colour = "#ededed", size = 0.5))
  

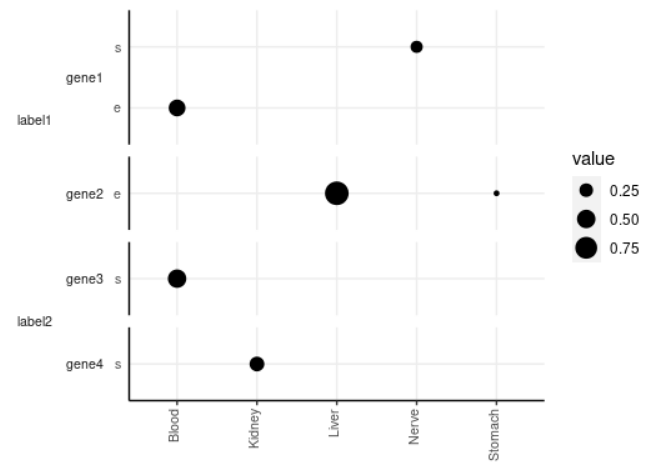
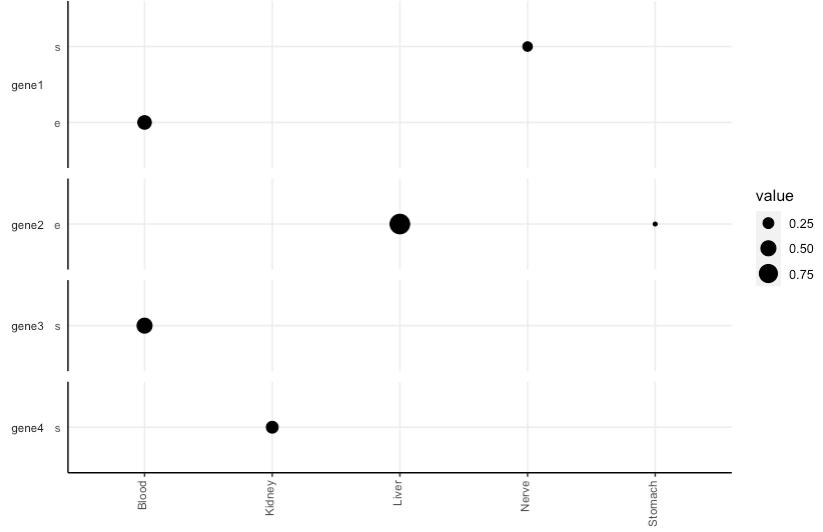
This yields the following plot:

However, what if I wanted to add a second facet grid label or second y-axis being the loci column. I've seen that you can do a facet_grid on two variables where one is the column and one is the row. How do I get it so that they are both rows?

I've looked into having it as a second y-axis but that seems to only work for continuous variables.

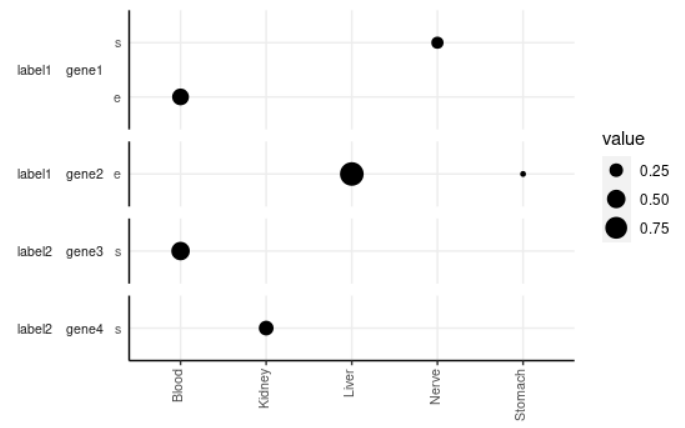
The desired plot I'm looking for is this:
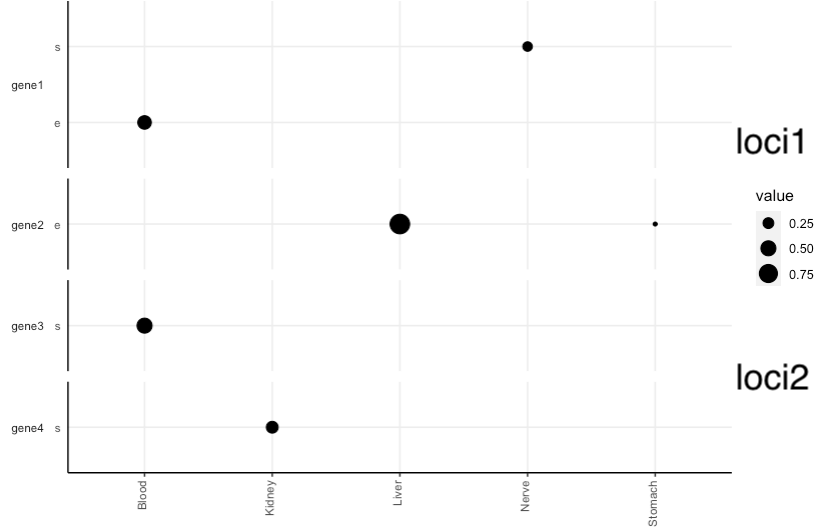
Thanks in advance!

I think the best you can do (easily) is this:

Using only ggplot2:

ggplot(df2, aes(x = tissue, y = qtl, size = value)) +
  geom_point() +
  facet_grid(
    rows = vars(second_label, gene),
    scales = "free", 
    space = 'free',
    switch = "y"
  ) +
  your_theme

image

Or with an extension package:

library(ggh4x)
ggplot(df2, aes(x = tissue, y = qtl, size = value)) +
  geom_point() +
  facet_nested(
    rows = vars(second_label, gene),
    scales = "free", 
    space = 'free',
    switch = "y"
  ) +
  your_theme

image

2 Likes

Thank you! This is very helpful. Is there any way to move the second_label to the right side and keep the gene facet on the left? Or do they both have to be on the same side?

Not easily (i.e without hacking ggplot internals), at least that I know of.

Or I suppose you could draw the text manually using annotate or similar (also cumbersome).

Good to know. I tried to do it manually on the right side using the secondary y-axis, but it has to be continuous so it did not work.

One last question:

Is there a simple way to right (or left) justify the gene facet labels? It seems the issue is non-trivial.

It helps if you show what you have tried.

I think you can only change the justification of all facet labels (strip text) at the same time. E.g.

theme(strip.text = element_text(size = 8, angle = 0, hjust = 0))

This topic was automatically closed 7 days after the last reply. New replies are no longer allowed.

If you have a query related to it or one of the replies, start a new topic and refer back with a link.