Hi,
I'm running a RDA analysis and I need to add sample names to my plot.
I can't add any categorical variable to my dataset since it doesn't allow me to run the analysis.
How can I solve this problem?
this is mu script:
"Env <-read.csv("RDAC_Env.csv", header=TRUE, dec=",", sep=";")
Enz <-read.csv("RDAC_Enz.csv", header=TRUE, dec=",", sep=";")
"
my_RDA<- rda(Enz ~ ., data= Env)
ordiplot(my_RDA, scaling = 1, type = "text")
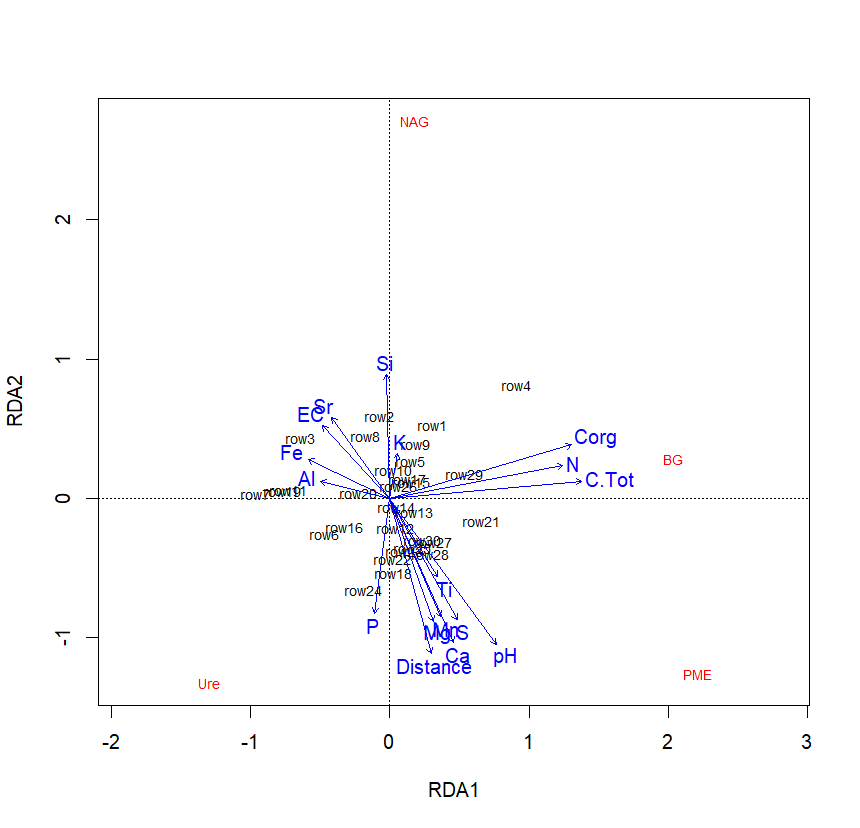
As you can see, it calls samples as "row1, row2, ..."
Hoe can I add the name and, maybe, the ellipse?
Thanks a lot.