I created the following code and corresponding plot:
# Load the data
rainfall_data <- read.csv("NWOWWC Rainfall Data.csv")

# Display the unique site names to check for any issues
print("Unique site names in the original data:")
print(unique(rainfall_data$Site))

# Filter out rows with null DOC values
filtered_data <- rainfall_data[!is.na(rainfall_data$DOC), ]

# Calculate mean, standard error, and sample size
calculate_summary <- function(data, variable, group_by) {
  aggregate(data[[variable]], by = list(data[[group_by]]),
            FUN = function(x) c(mean = mean(x, na.rm = TRUE), se = sd(x, na.rm = TRUE) / sqrt(length(na.omit(x))), n = length(na.omit(x))))
}

# Assuming filtered_data is your dataset
summary_data <- calculate_summary(filtered_data, "DOC", "Site")

# Rename columns for easier access
colnames(summary_data) <- c("Site", "DOC_stats")
summary_data <- data.frame(Site = summary_data$Site,
                           mean_DOC = summary_data$DOC_stats[, "mean"],
                           se_DOC = summary_data$DOC_stats[, "se"],
                           n = summary_data$DOC_stats[, "n"])

# Display the summary data to check for any issues
print("Summary data:")
print(summary_data)

# Ensure all desired sites are included with NA values if missing
all_sites <- c("BC1Up", "BC1In1", "BC1In2", "BC1Out", "BC1Down", "RefUS", "RefIn", "RefDown", "BC2In", "BC2Out", "BC3In", "BC3Out")
missing_sites <- setdiff(all_sites, summary_data$Site)
if (length(missing_sites) > 0) {
  missing_data <- data.frame(Site = missing_sites, mean_DOC = NA, se_DOC = NA)
  summary_data <- rbind(summary_data, missing_data)
}

# Reorder the levels of the Site factor
summary_data$Site <- factor(summary_data$Site, levels = all_sites)

# Ensure the data is ordered correctly
summary_data <- summary_data[order(summary_data$Site), ]

# Display the final ordered summary data to ensure correctness
print("Final ordered summary data:")
print(summary_data)

# Check for any additional levels that might be causing the extra bar
print("Levels of Site factor:")
print(levels(summary_data$Site))

# Define the font as Times New Roman
par(family = "serif")

# Define colors for each site
colors <- c("grey", "darkblue", "darkblue", "lightblue", "grey", "grey", "red", "grey", "darkgreen", "lightgreen", "violet", "darkmagenta")

# Ensure there is at least one row to plot
if(nrow(summary_data) > 0) {
  # Increase bottom margin size to make room for x-axis title
  par(mar = c(8, 5, 5, 4)) # Adjusted margin to make more space for x-axis labels
  # bottom, left, top, right
  # Create the bar graph with standard error bars
  bar_centers <- barplot(summary_data$mean_DOC, names.arg = summary_data$Site,
                         col = colors, ylim = c(0, max(summary_data$mean_DOC + summary_data$se_DOC, na.rm = TRUE) * 1.1),
                         ylab = "Mean DOC (mg/L)", las = 2, cex.names = 0.8)

  # Add error bars (only if mean and se values are not NA)
  arrows(bar_centers, summary_data$mean_DOC - summary_data$se_DOC,
         bar_centers, summary_data$mean_DOC + summary_data$se_DOC,
         angle = 90, code = 3, length = 0.1)
  title(xlab = "Site")

  # Add x-axis label further down
  mtext("Site", side = 1, line = 100) # Adjust the 'line' parameter as needed to move the label down
} else {
  print("No finite mean DOC values to plot.")
}
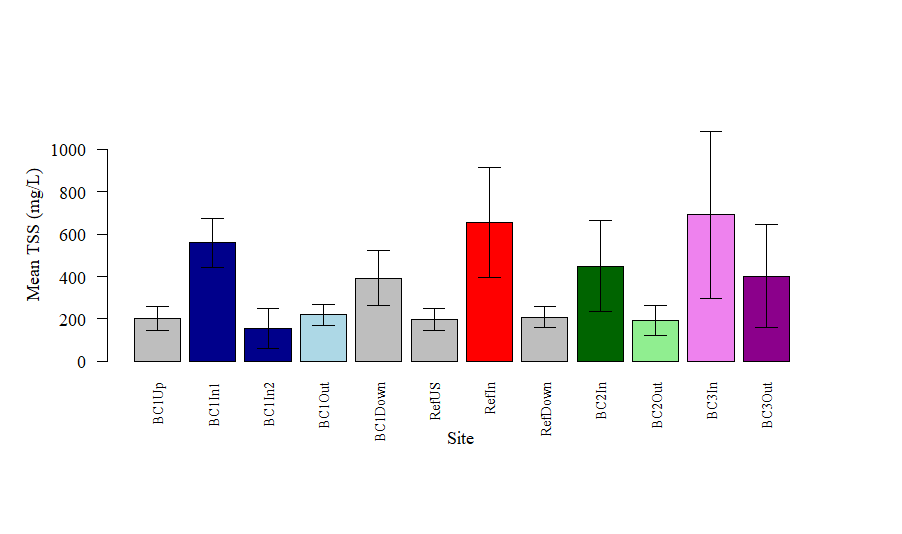
I would now like to add the sample sizes above each error bar. Above BC1Up should display "n = 20", above BC1In1 should display "n = 20", above BC1In2 should display "n = 5", above BC1Out should display "n = 20", above BC1Down should display "n = 20", above "RefUS" should display "n = 20", above "RefIn" should display "n = 20", above "RefDown" should display "n = 20", above "BC2In" should display "n = 8", above "BC2Out" should display "n = 8", above "BC3In" should display "n = 10" and above "BC3Out" should display "n = 10". Does anyone have any advice as to how to add these sample sizes above the plots.
TIA