Hi! I have made this plot in R.
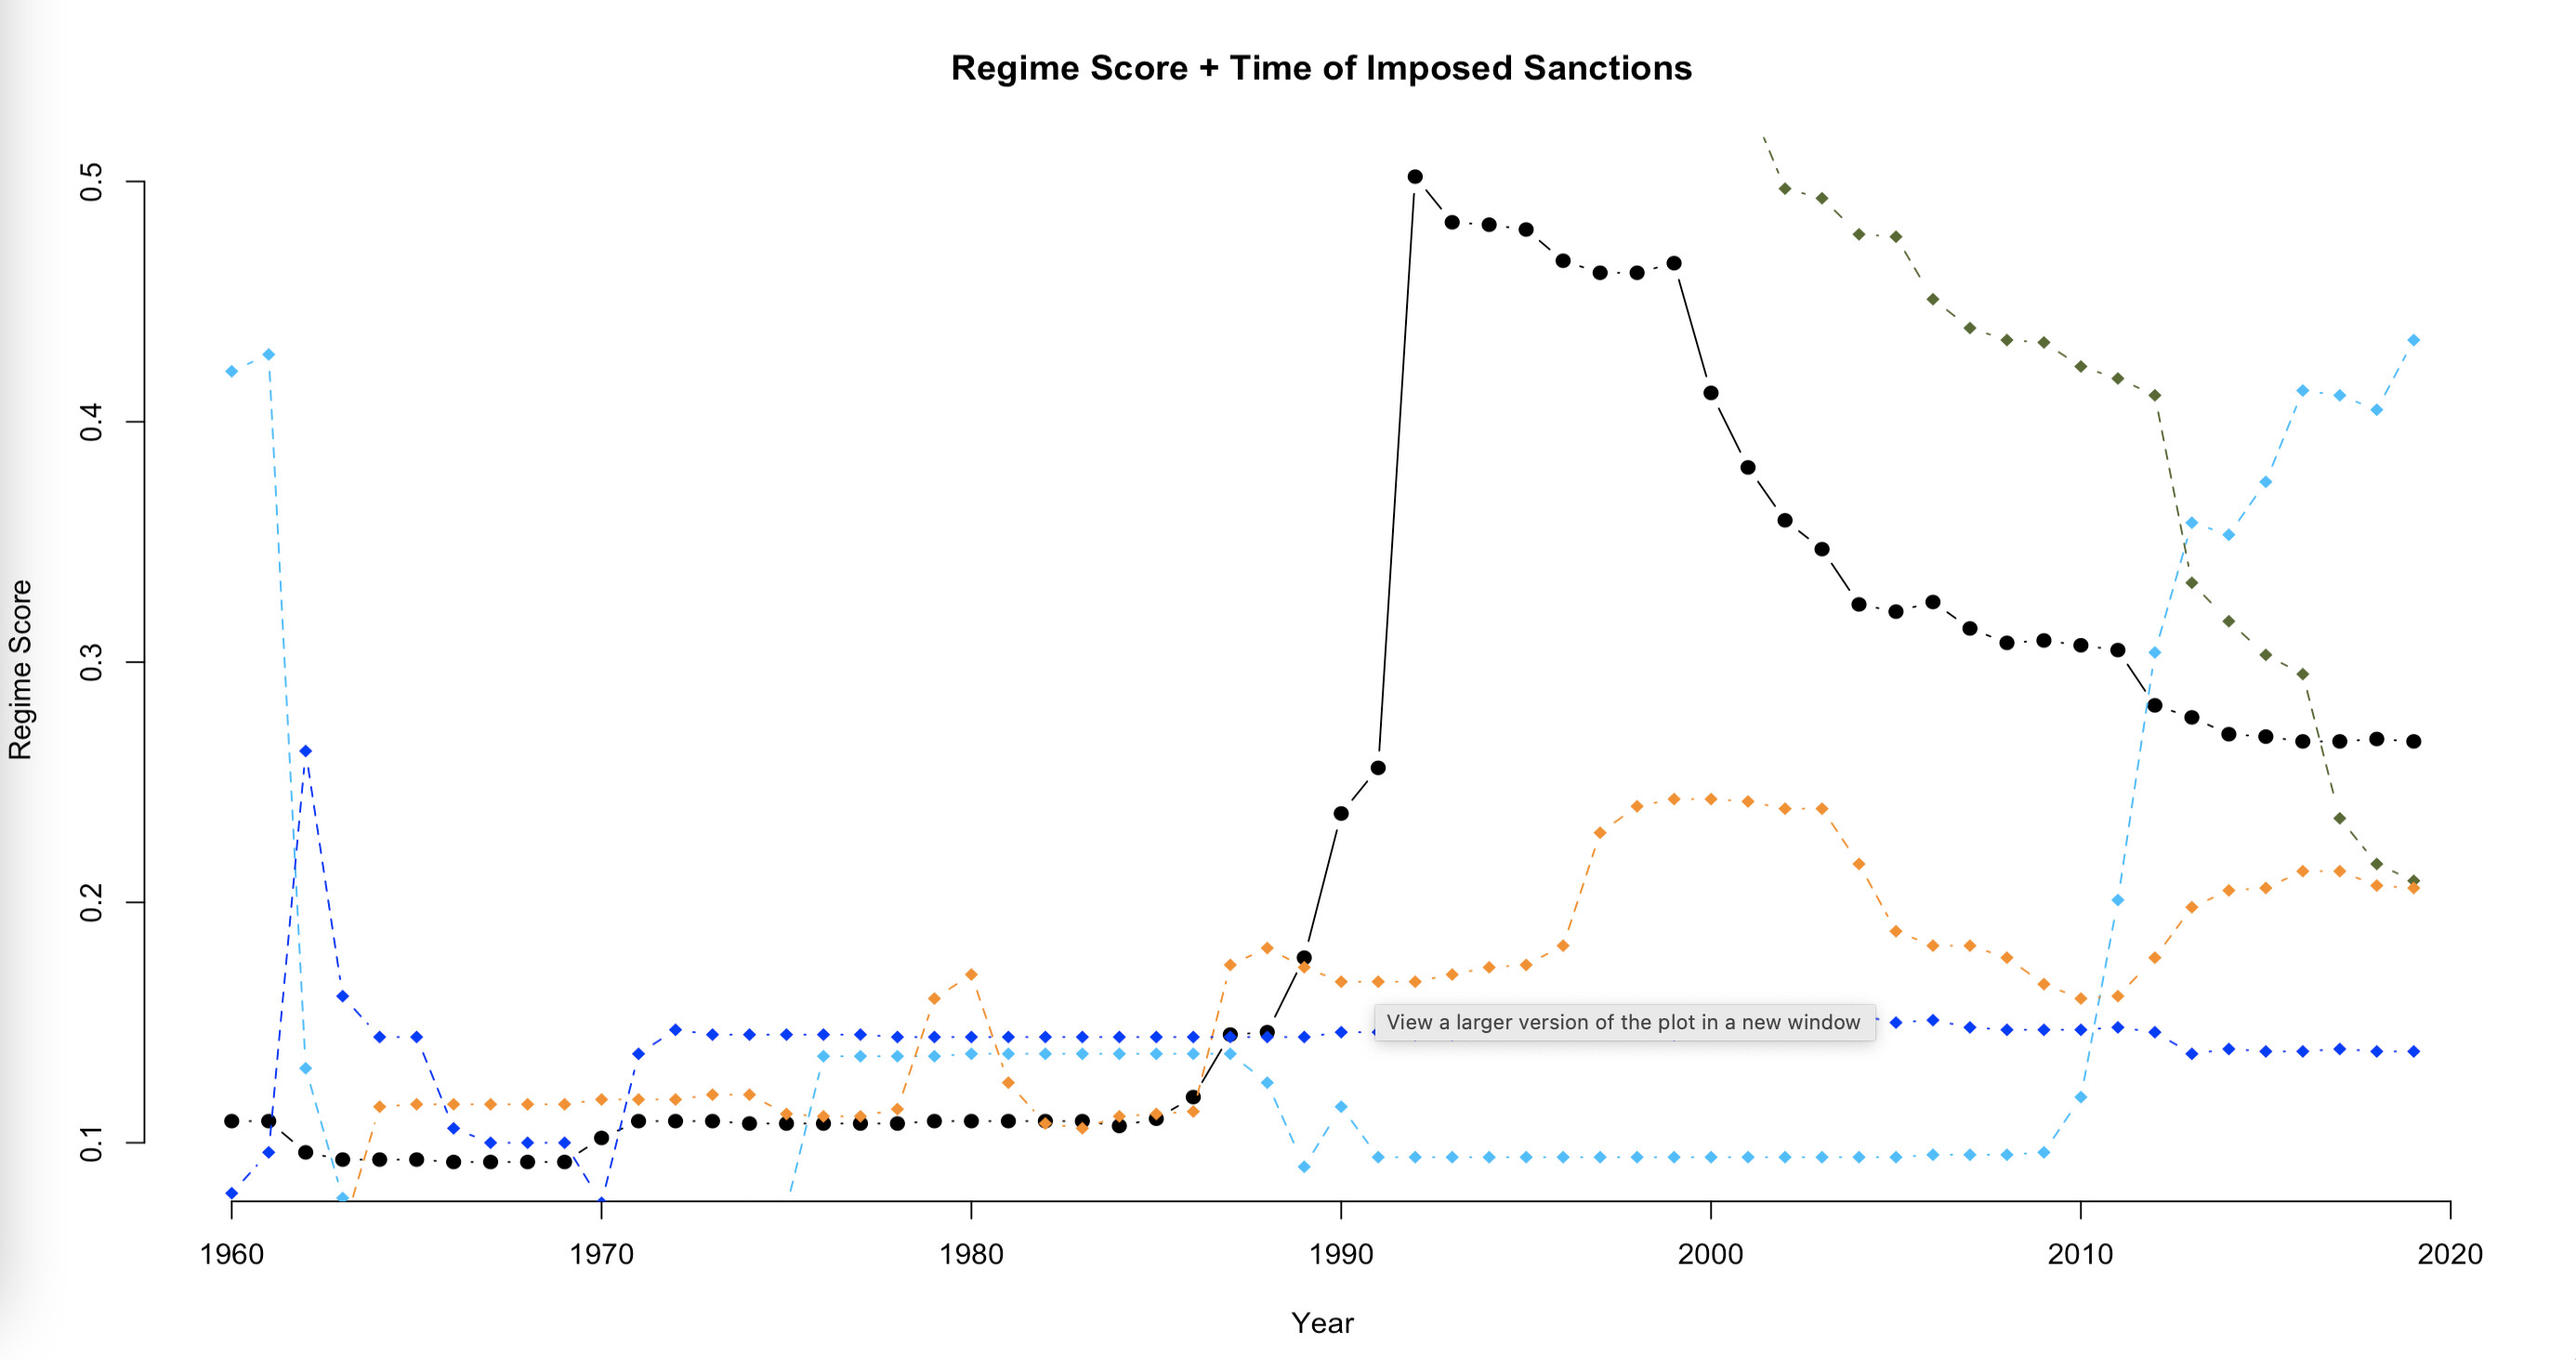
On the Y axes, my "regime score" values is set fra 0-0.5, but in my observations the values are form 0-1.
Does anyone know how I can make the y axes to show all 0-1?
Hi! I have made this plot in R.
On the Y axes, my "regime score" values is set fra 0-0.5, but in my observations the values are form 0-1.
Does anyone know how I can make the y axes to show all 0-1?
I think we need a see your code and some sample data.
A handy way to supply some sample data is the dput() function. In the case of a large dataset something like dput(head(mydata, 100)) should supply the data we need. Just do dput(mydata) where mydata is your data. Copy the output and paste it here.
When you make the initial plot use ylim param for your range i.e. c(0,1)
This topic was automatically closed 42 days after the last reply. New replies are no longer allowed.
If you have a query related to it or one of the replies, start a new topic and refer back with a link.