Thanks for the suggestion, @jrkrideau. You were right about the as.layer function.
Using the resources you directed me to, I found 2 solutions to my problem.
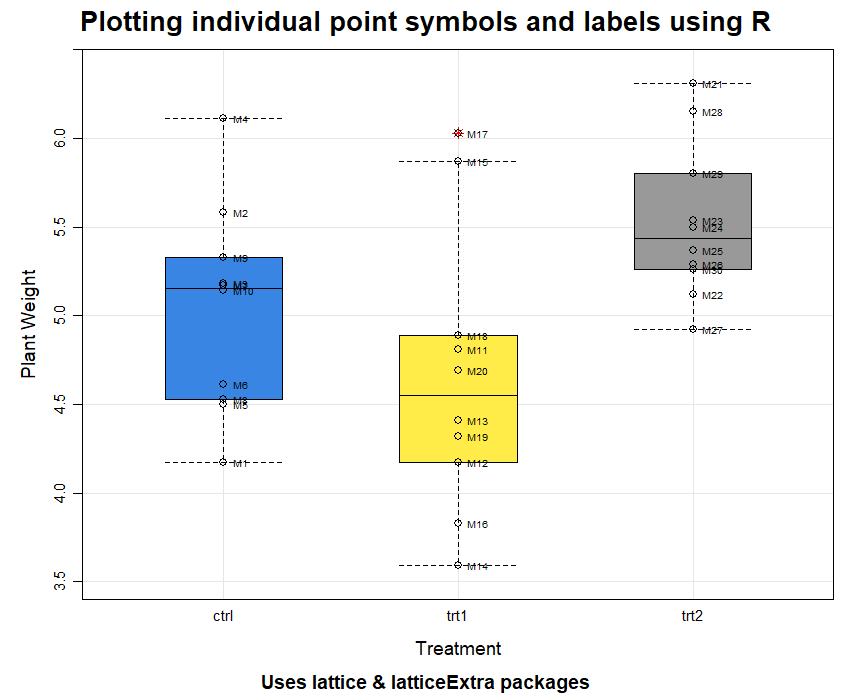
- Using lattice and latticeExtra packages
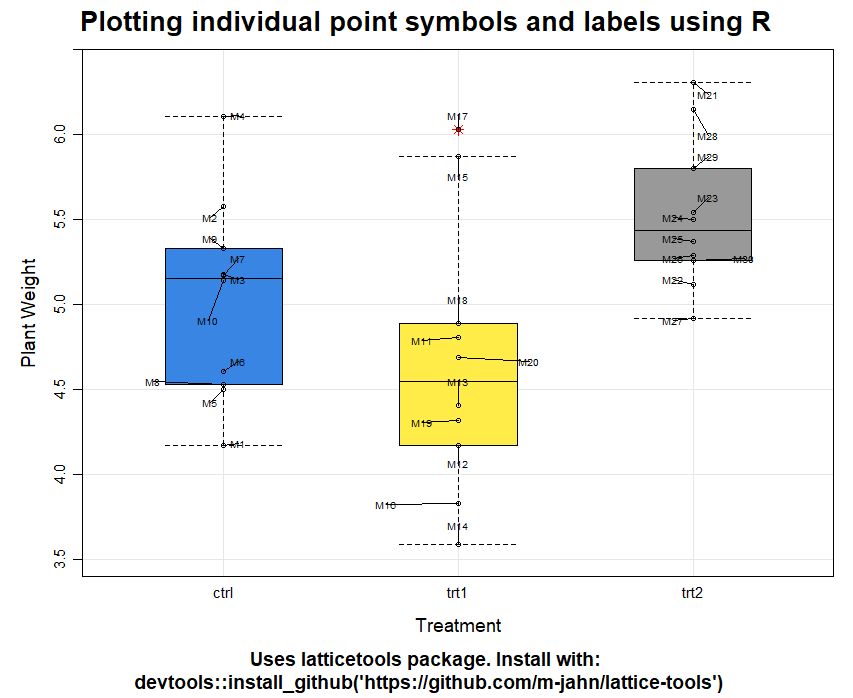
- Using a third package, latticetools, to add optional callout lines between labels and points
Apologies for the odyssey that follows; it's not Shakespeare but it's serviceable.
Solution 1:
# load libraries
library(lattice)
library(latticeExtra)
# make some data
my_data <- PlantGrowth
my_data$MeasurementID <- sprintf("M%s", seq(1:nrow(my_data)))
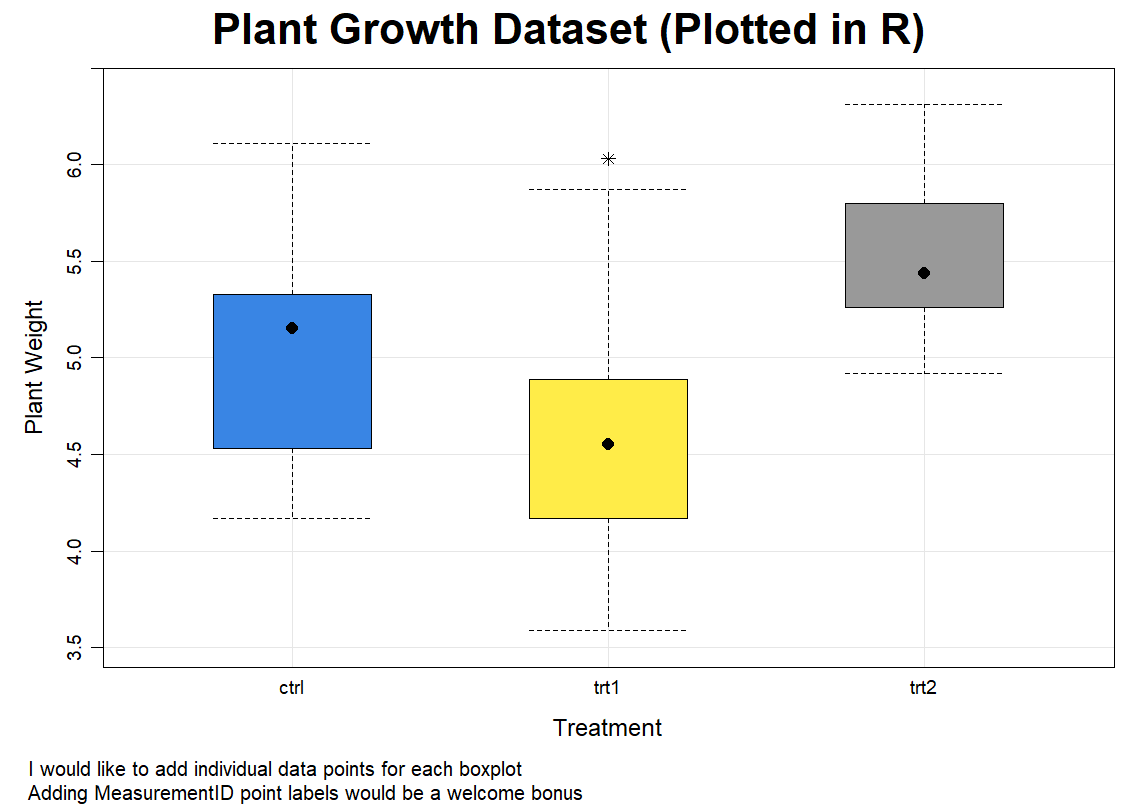
# plot those data
bwplot(weight ~ group,
data = my_data,
axis = axis.grid,
main = "Plotting individual point symbols and labels using R",
sub = "Uses lattice & latticeExtra packages",
scales = "free",
xlab = "Treatment",
ylab = "Plant Weight",
# use line instead of dot for median symbol
pch = "|",
# additional boxplot element settings
par.settings = list(
box.rectangle = list(
# use these box fill colors
fill = rep(c("#3985E4", "#FFEC48", "#999999"), 3),
# make box outlines black
col = "black"
),
# make whiskers black
box.umbrella = list(
col = "black"
),
# make outlier symbols red stars
plot.symbol = list(
col = "red",
pch = 8
),
# make title text 18pt
par.main.text = list(
fontsize = 14
)
)
) +
# add individual points to existing plot
as.layer(xyplot(weight ~ group,
# select dataframe
data = my_data,
# function that adds labels
panel = function(x, y, ...) {
panel.xyplot(x, y, ...)
panel.text(x, y,
# select field that has point labels
labels = my_data$MeasurementID,
# make labels black
col = "black",
# set label size
cex = 0.5,
# set label position; 4 is to the right of points
pos = 4,
# this controls how far labels are drawn from points
offset = 1
)
},
# tweak individual point display
par.settings = list(
plot.symbol = list(
# make individual points black
col = "black",
# make individual points open circles
pch = 1
)
)
))
Solution 2:
# load libraries
library(lattice)
library(latticeExtra)
library(latticetools)

# make some data
my_data <- PlantGrowth
my_data$MeasurementID <- sprintf("M%s", seq(1:nrow(my_data)))

# plot the data
bwplot(weight ~ group,
  data = my_data,
  axis = axis.grid,
  main = "Plotting individual point symbols and labels using R",
  sub = "Uses latticetools package. Install with:\n devtools::install_github('https://github.com/m-jahn/lattice-tools')",
  scales = "free",
  xlab = "Treatment",
  ylab = "Plant Weight",
  # use line instead of dot for median symbol
  pch = "|",
  # additional boxplot element settings
  par.settings = list(
    box.rectangle = list(
      # use these box fill colors
      fill = rep(c("#3985E4", "#FFEC48", "#999999"), 3),
      # make box outlines black
      col = "black"
    ),
    # make whiskers black
    box.umbrella = list(
      col = "black"
    ),
    # make outlier symbols red stars
    plot.symbol = list(
      col = "red",
      pch = 8
    ),
    # make title text 18pt
    par.main.text = list(
      fontsize = 14
    )
  )
) +
  # add individual points
  as.layer(xyplot(weight ~ group,
    # select dataframe
    data = my_data,
    # select field that has point labels
    labels = my_data$MeasurementID,
    # set label size
    cex = 0.5,
    # function that actually adds labels
    panel = function(x, y, ...) {
      panel.xyplot(x, y, ...)
      panel.directlabels(x, y, ...)
    },
    # tweak individual point display
    par.settings = list(
      plot.symbol = list(
        # make individual points black
        col = "black",
        # make individual points open circles
        pch = 1
      )
    )
  ))