I am making a graph in ggplot2 (geom_line) with two lines (split by color in aes) - and both show up within the legend. However, I am also making a different line (stat_function(geom = 'line', color = "black", ...)). Is there a way for me to add a black line to the first legend, so that it looks as if it was all one thing?
At the moment, I avoided the issue, by using the function to create the data for an extra line, so I just plot them all with geom_line...but it would be more direct to just do it all directly.
Might you be able to post a reproducible example (reprex) with a bit of data? That way we can see what's happening at each step— it's hard to envision what you've got going on (at least for me) without seeing the output or the input!
If you're not familiar with reprex, I also recommend taking a look at Nick Tierney's reprex post.
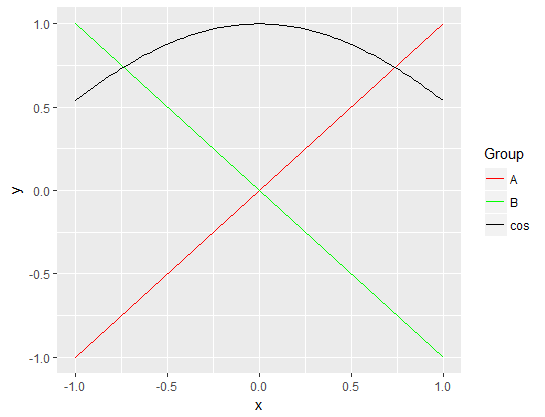
While a reprex would help, if I'm following you, the main trick is to assign a "fake" color aesthetic rather than manually overriding the color in the stat_function call. That means that you either have to use scale_color_manual if you really want a black line, or you have to accept stat_function being some automatically chosen color.
suppressPackageStartupMessages(library(tidyverse))

dat <- tribble(
  ~ Group, ~ x, ~ y,
  "A", -1, -1,
  "A", 1, 1,
  "B", -1, 1,
  "B", 1, -1
)

ggplot(data = dat) +
  geom_line(aes(x = x, y = y, color = Group)) +
  stat_function(fun = cos, aes(color = "cos")) +
  # The next line could be left out if any color is acceptable
  scale_color_manual(values = c(A = "red", B = "green", cos = "black"))