Add discrete color scale to plot with multiple layers

Hello,

I am trying to change the colors of one of my data layers in a ggplot2.

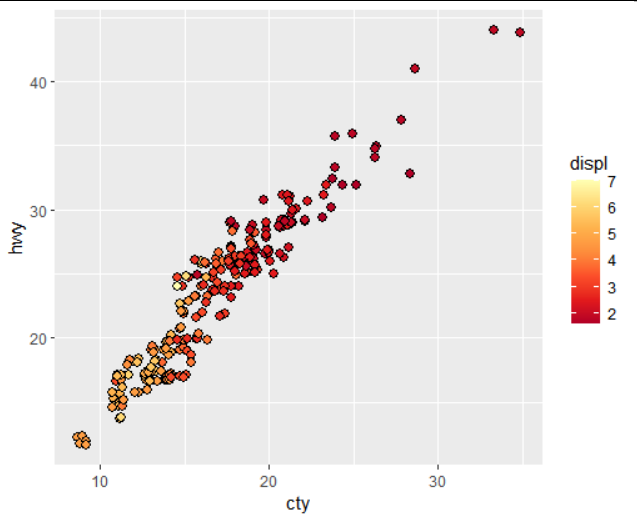
library(RColorBrewer)

cols <- brewer.pal(5, "YlOrRd") # this is the palette I want

ggplot() +
  geom_sf(data=lksup, fill="white") +
  geom_sf(data=buffer, aes(fill=distance)) + # this is layer I want changed
  scale_fill_manual(values = cols) +
  geom_sf(data=data, aes(col=Type, shape=Type), size=2.5) +
  coord_sf(xlim = c(-92.3, -90.5), ylim = c(47.1, 46.55), expand = F) +
  themes

However, when I use scale_fill_manual() I get the following error message:

Error: Continuous value supplied to discrete scale

I have tried other commands, such as scale_fill_brewer(), but I still keep getting the same error.

Does anyone know what command will change my buffer data layer to the color palette I want?

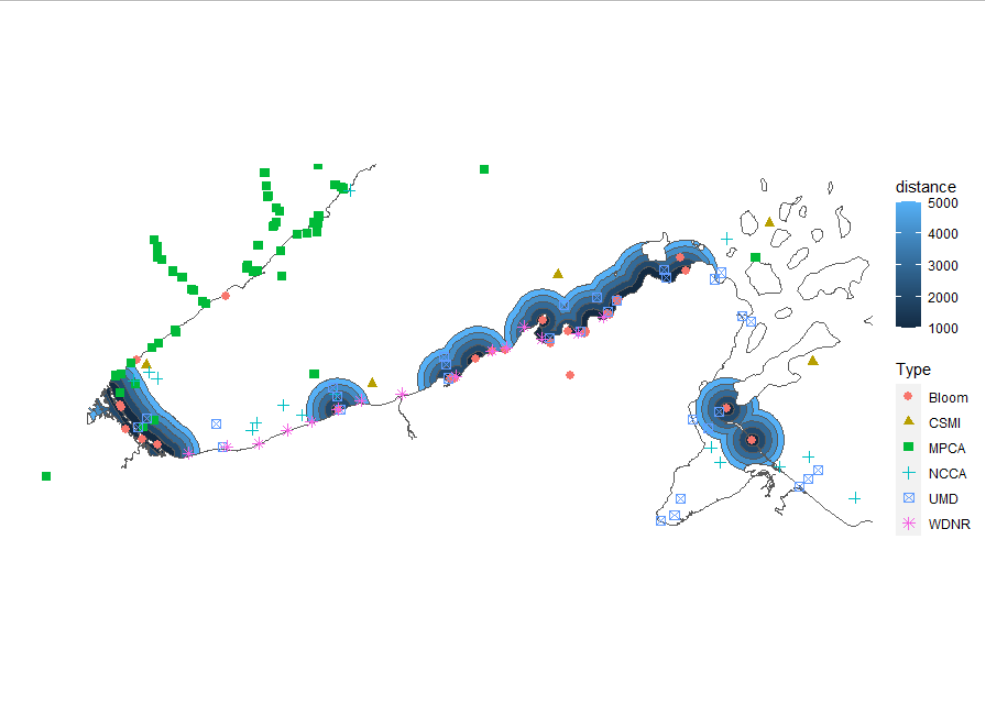
Here is a photo of my plot for reference. The blue polygons are what I want to change.

Thanks so much!

Indeed it seems to be not very simple to use RColorBrewer scales with continous data, even though it includes some sequential palettes.

To really use it for continous data use scale_fill_distiller().

ggplot(mpg,
       aes(x = cty, y = hwy, fill = displ)) +
  geom_jitter(shape = 21, size = 2.5) +
  scale_fill_distiller(palette = "YlOrRd")

Another option would be to supply the scale to scale_fill_gradient:
(Interestingly here the direction is interpreted in a different way)

ggplot(mpg,
       aes(x = cty, y = hwy, fill = displ)) +
  geom_jitter(shape = 21, size = 2.5) +
  scale_fill_gradientn(colours = brewer.pal(5, "YlOrRd"))

This topic was automatically closed 21 days after the last reply. New replies are no longer allowed.

If you have a query related to it or one of the replies, start a new topic and refer back with a link.