Hello everyone,
Hello to all of you,
I'm making an interactive R map with the Leaflet package, the application domain is related to zoology with the distribution of the Hedgehogs of the World.
Luckily I have already found some well done tutorials on the internet to train myself and produce the result.
Nevertheless, to make it perfect I still have a problem with one thing of great importance.
Here's my code
# - - -  Project Map Hedgehogs


library(shiny)

library(shinythemes)

library(leaflet)

library(leaflet.providers)

library(dplyr)

library(maps)

library(RColorBrewer)

library(leaflet.extras)

library(rworldxtra)

library(raster)

library(sf)

library(tidyverse)


# 0] Load data


Data_Herisson <- read.csv("XXXXX/Documents/Question hérisson.csv")


# 1] Color from a factor which is " Genus Name "


Genus_names <- Data_Herisson$genus_name  %>% unique()


# Palette de couleurs


library(RColorBrewer)

brewer.pal(n = 3, name = "Paired")

Color <- c("blue","red","green")


pal <- colorFactor(Color,domain = Genus_names)


# [FINAL] Afficher la carte

Map_Herisson<-leaflet() %>%
  addProviderTiles("Esri.WorldImagery") %>%
  addCircleMarkers(data = Data_Herisson,
                   lat = ~latitude,
                   lng = ~longitude,
                   color = ~pal(Data_Herisson$genus_name),
                   stroke = FALSE,
                   popup = paste("Taxinomie : ", Data_Herisson$complete_name,
                                 "<br>",
                                 "N° échantillonnage : ", Data_Herisson$specimen_code,
                                 "<br>","<br>","<hr>",
                                 "Mode de conservation : ", Data_Herisson$preservation_method,
                                 "<br>",
                                 "Date prélèvement : ", Data_Herisson$date_collected,
                                 "<br>",
                                 "Statut étude phylogénétique : ", Data_Herisson$phylogeny_status),
                   label = ~as.character(name),
                   clusterOptions = markerClusterOptions(),
                   fillOpacity = 0.5)


# Ajout Légende des Genres à la Carte

Map_Herisson %>% addLegend(data = Data_Herisson,
                              position = "topright",
                              pal = pal,
                              values = Data_Herisson$genus_name,
                              title = "Genres de Brentidae",
                              opacity = 1)
Voici ce que j'obtiens ce qui est déjà très satisfaisant :
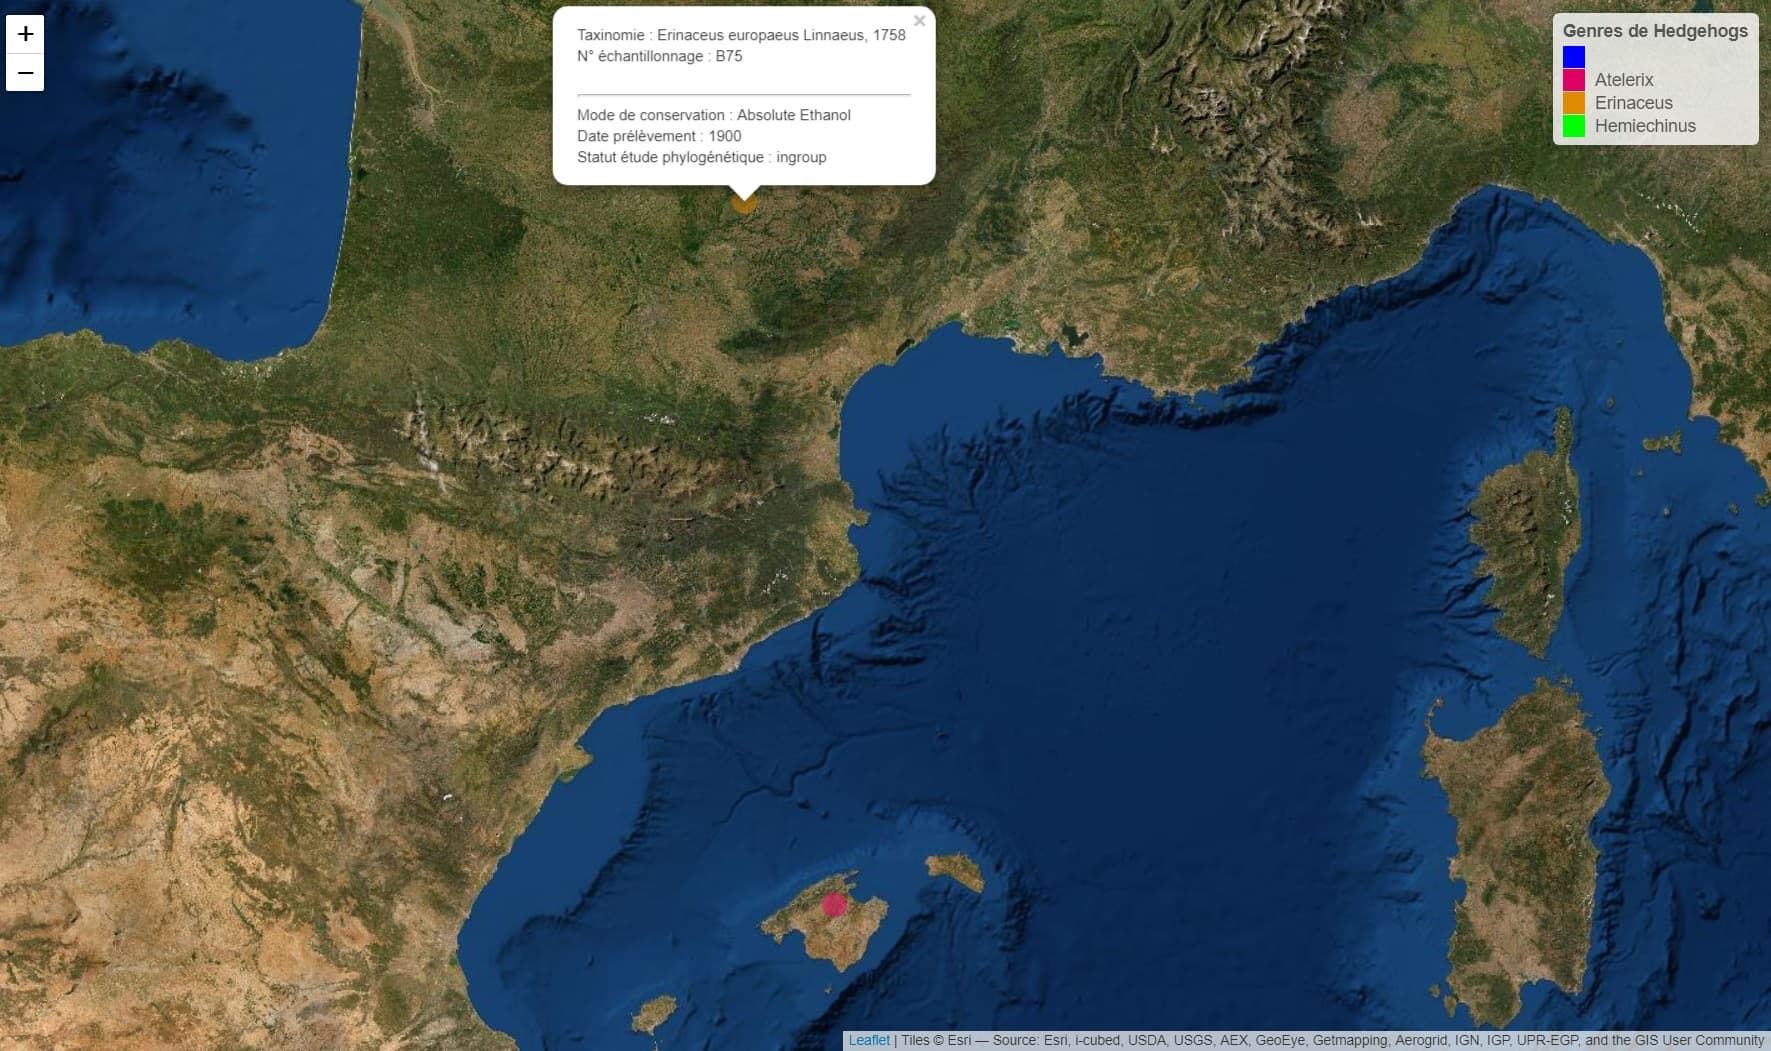
My question is the following, how can I display in the popup a photo of each specimen?
It would be possible to use a link to a photo of the taxon, but that would break the aesthetic and interactive interest of the thing.
I have already seen and understood how to add a photo that is displayed for each marker (Source : Add a pop-up with an image to a leaflet map in R) but I can't figure out how to do it knowing that my real dataset is much larger .... ![]()
If this works, the result would be truly wonderful ! ![]()
Thak you in advance, wishing you a great day