Hi all,
I need some help with improving my carrier chart. I’m currently using geom_tile() to show defects in the carrier. Here is my current function:
dp_create_carrier_distribution_plot <- function(dt){
NG_carrier <- select(dt, AA_Carrier_Row, AA_Carrier_Col)

carrier_map <- rbind(fol_carrier, NG_carrier) %>%
  mutate(AA_Carrier_Row = case_when(AA_Carrier_Row == 3 ~ 1,
                   AA_Carrier_Row == 2 ~ 2,
                   AA_Carrier_Row == 1 ~ 3),
         AA_Carrier_Col = 8 - as.numeric(AA_Carrier_Col)) %>%
  count(AA_Carrier_Row, AA_Carrier_Col) %>%
  mutate(n1 = n - 1)

ggplot() +
  # Non-blank tiles with gradient
  geom_tile(data = carrier_map,
            aes(x = AA_Carrier_Col, y = AA_Carrier_Row, fill = n1),
            color = "gray88", lwd = 5, radius = unit(6, "pt")) +
  theme_light() +
  scale_x_continuous(breaks = c(0,1,2,3,4,5,6,7),
                     labels = rev(1:8)) +
  scale_y_continuous(breaks = c(1, 2, 3),
                     labels = rev(1:3)) +
  coord_fixed() +
  geom_text(data = subset(carrier_map, n1 > 0),
            aes(x = AA_Carrier_Col, y = AA_Carrier_Row, label = n1), color = "white", size = 4)
}
Here’s what the current chart looks like:
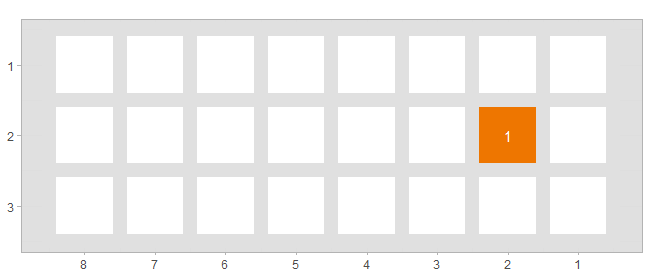
I want to add some visual cues to the carrier background so that it’s easy to tell the head and tail of the carrier, like in this example:

Does anyone have suggestions or ideas on how I could achieve this in
ggplot2?TIA!