Dear community
Can pls somebody help me. I did a ggplot with six observations (see below).
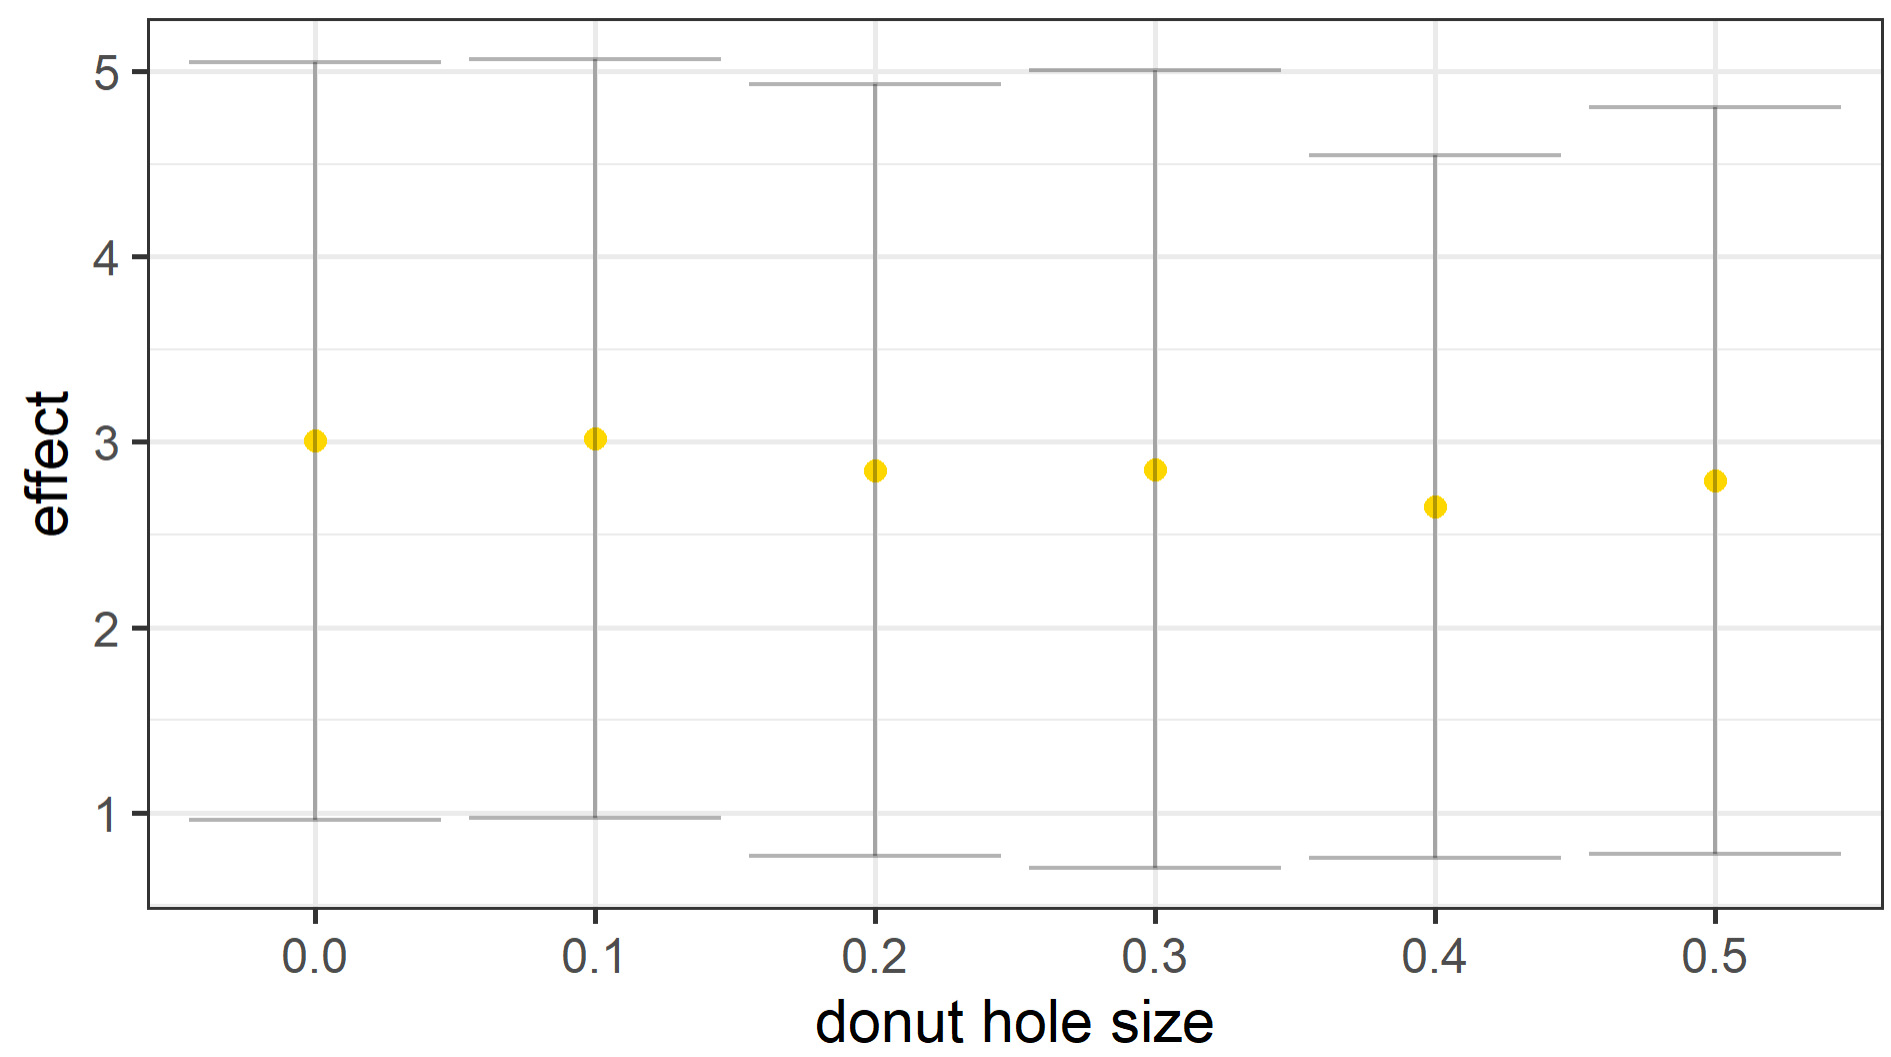
Now my question is. How can I add the real effect value to each of the datapoints?
My Code:
ggplot(data_finaly, aes(x = row_num, y = effect)) +
geom_line(aes(y = effect, color='effect'),size=1.25, data = data_finaly, color='gold') +
geom_point(aes(y = sig), shape = 19, size = 5, data = data_finaly, color='gold') +
geom_errorbar(aes(ymin = cil, ymax = cih), alpha=0.3,size=1, color='black')+
theme_bw(base_size = 30) +
xlab("donut hole size") +
ylab("effect") +
labs(color='Sample')
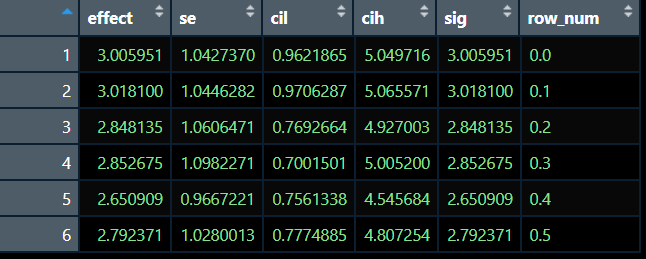
My Data:
Thank you so much in advance.
rstudiolooser