Hello,
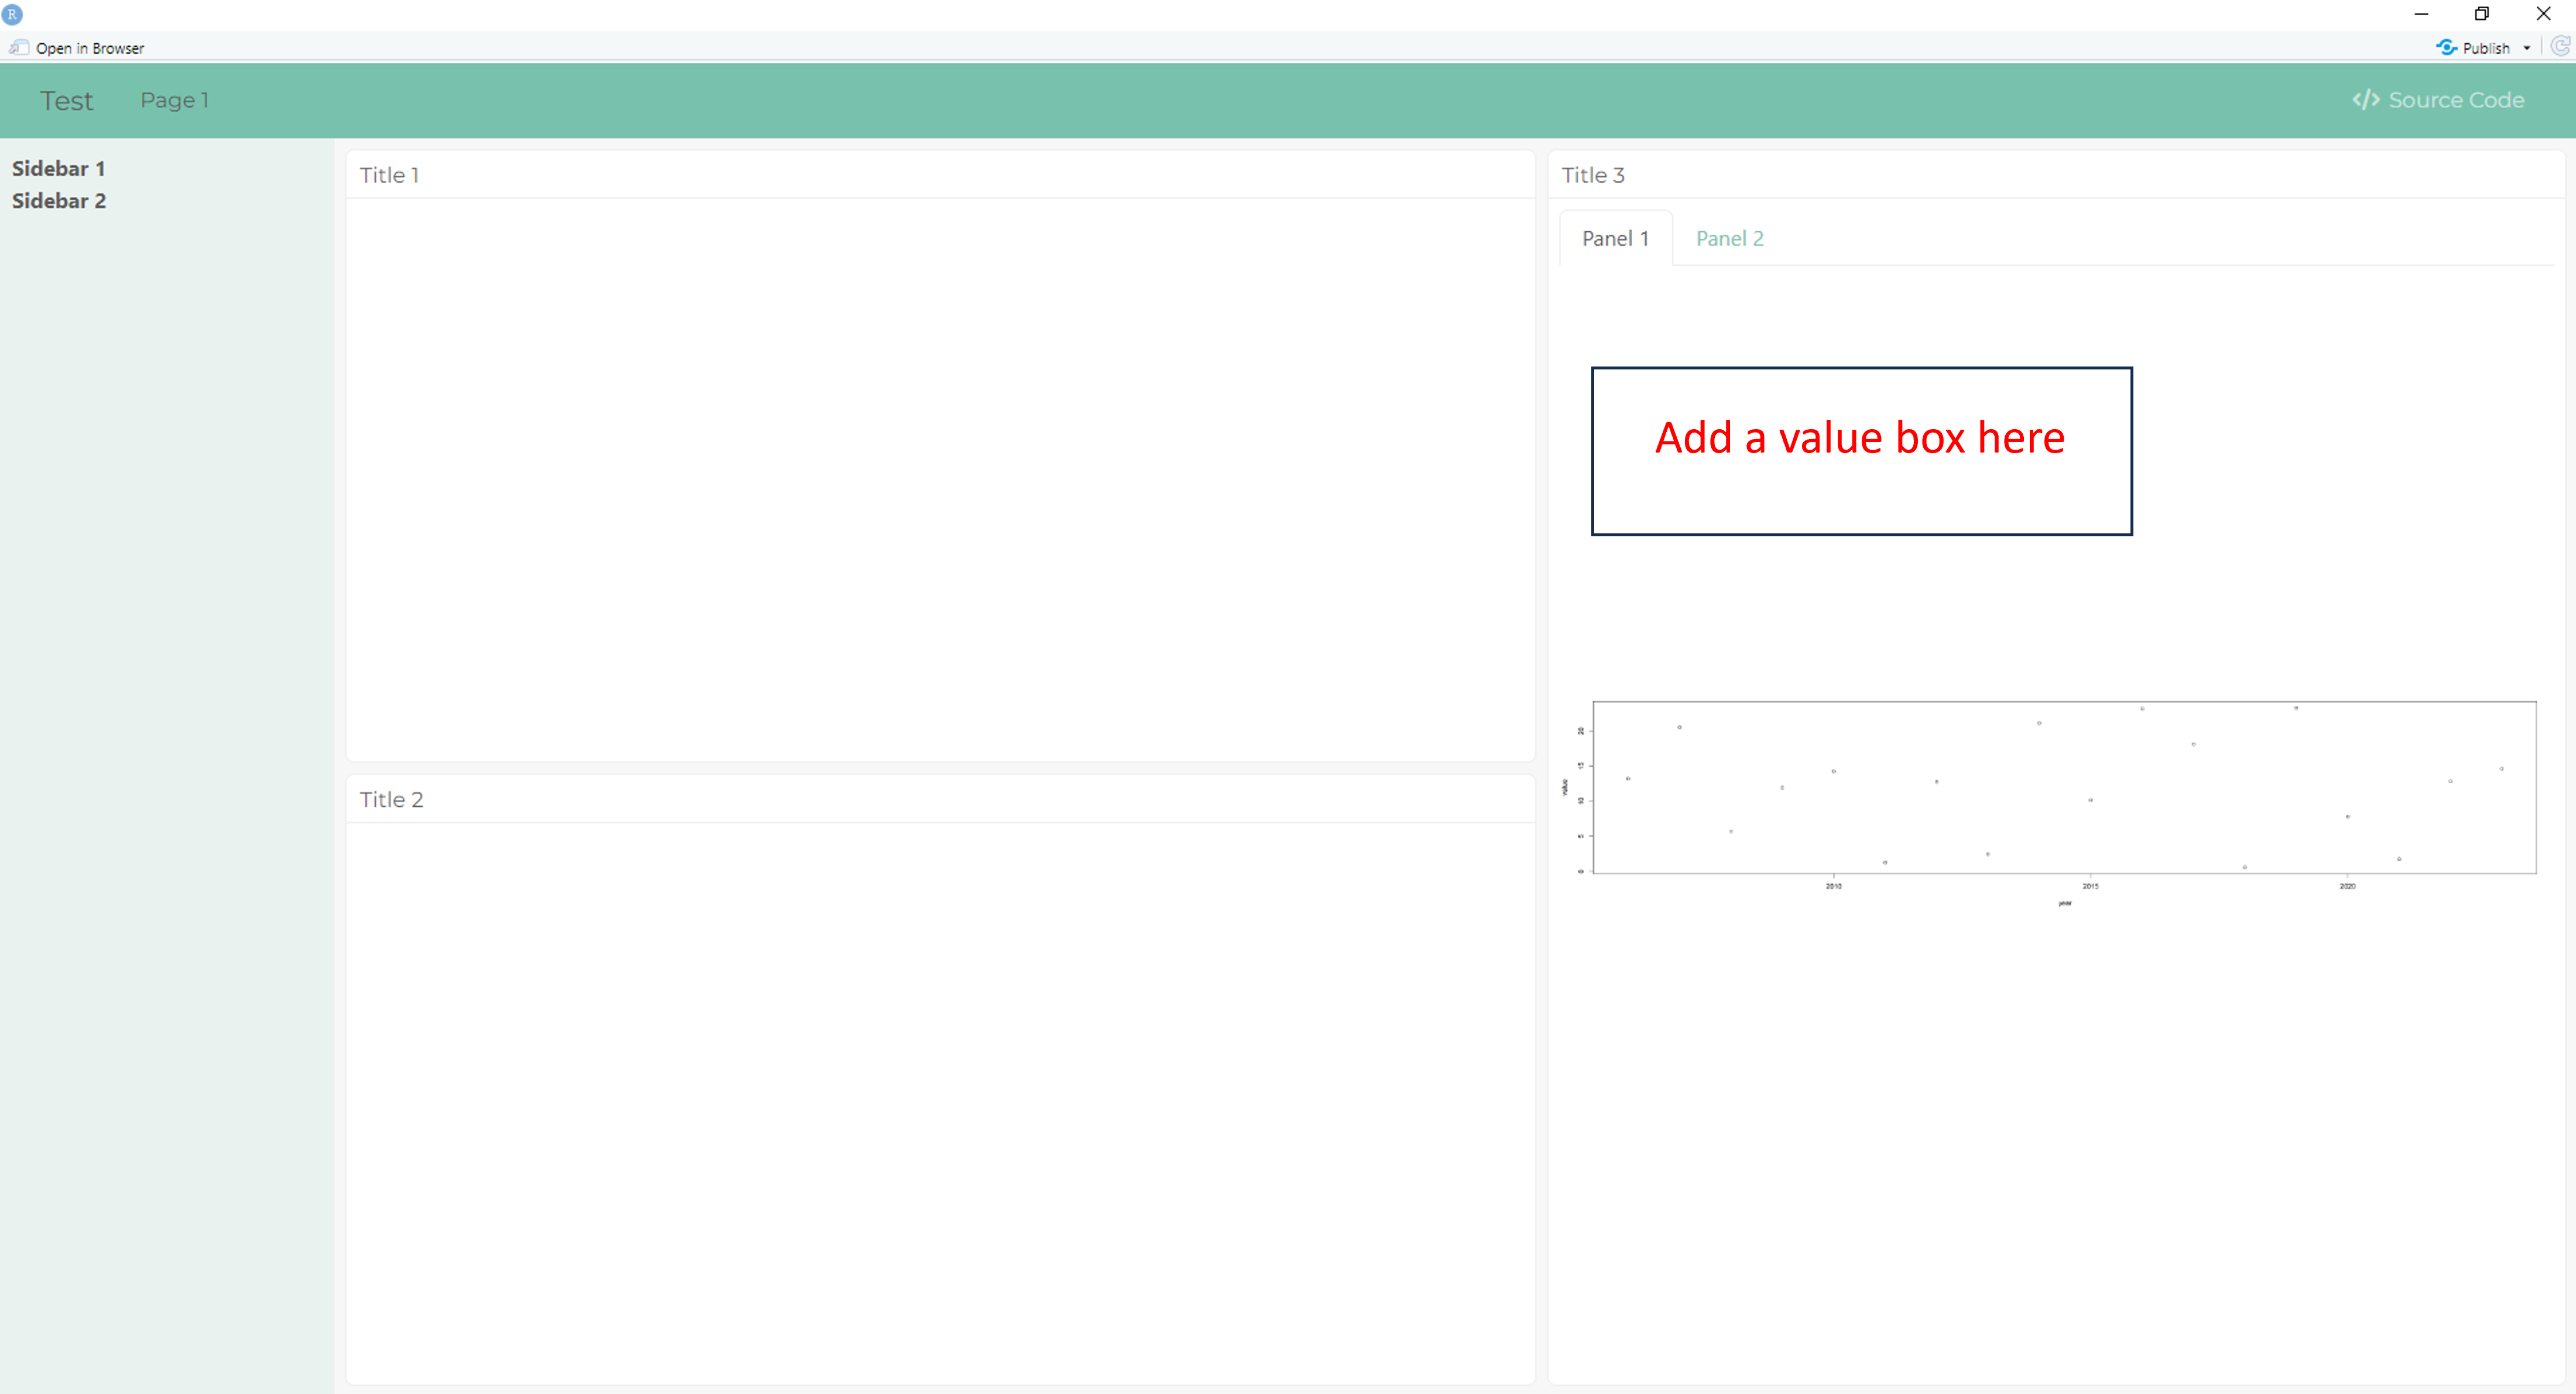
I’m beginning to learn how to create dashboards using the flexdashboard package. However, I have encountered an issue to add a value box using the valueBox function. In particular, how can I add a value box above the plot in Panel 1 and Panel 2 ?
> ---
> title: "Test"
> output:
>   flexdashboard::flex_dashboard:
>     theme:
>       version: 4
>       bootswatch: minty
>     orientation: columns
>     source_code: embed
> runtime: shiny
> ---
>
> ```{r global, include = FALSE}
> rm(list=ls(all=TRUE))
> library(ggplot2)
> library(plotly)
> library(flexdashboard)
> library(shinydashboard)
> library(shiny)
> library(rmarkdown)
>
> year <- seq(2006, 2023, 1)
> value <- runif(length(year), min = 0, max = 25)
>
>
> ```
>
> Sidebar {.sidebar}
> =====================================
>
> **Sidebar 1**
> ```{r}
>
> ```
>
> **Sidebar 2**
> ```{r}
>
> ```
>
> Page 1
> =======================================================================
>
> Column {data-width=700}
> -----------------------------------------------------------------------
>
> ### **Title 1**
>
> ```{r, fig.width = 5, fig.height= 10}
> ```
>
> ### **Title 2**
>
> ```{r, fig.width = 5, fig.height= 10}
> ```
>
> Column {data-width=600}
> -----------------------------------------------------------------------
>
> ### **Title 3**
>
> ```{r, fig.width = 24, fig.height= 6}
>
> b <- flexdashboard::valueBox(1000, icon = "fa-line-chart",col="orange")
>
> ## Retrieve the plot
> p <- plot(year, value)
> rp <- renderPlot({p}, height = 400, width = 600, res = 50)
>
> tabsetPanel(tabPanel("Panel 1", rp), tabPanel("Panel 2", rp))
> ```
I have tried the following code but it doesn’t work:
tabsetPanel(tabPanel("Panel 1", b, rp), tabPanel("Panel 2", b, rp))
Thank you very much for your help