Fitch92
1
Hello,
I just plotted my ACF and PACF Plot after differentiating the time series.
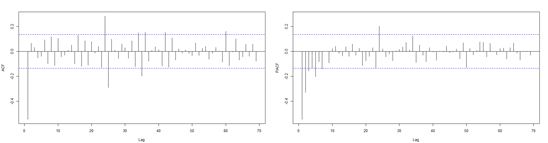
I as well used the auto.arima() function to get the final model. I therefore received:
for AIC:
ARIMA(0,1,2)(1,0,0)[52]
for BIC:
ARIMA(1,1,1)
I actually have no idea how one should read the plots to get these results. For me its a little contrary.
Can you help me?
Thank you in advance.
??forecast::auto.arimawill auto use the best c(p, d, q)
Here is example binary.com 面试试题 I - GARCH 模型中的 ARIMA(p,d,q) 参数最优化
I know, but I actually don`t get how forecast::auto.arima gets these values just from looking at the ACF and PACF plots
system
Closed
4
This topic was automatically closed 21 days after the last reply. New replies are no longer allowed.
If you have a query related to it or one of the replies, start a new topic and refer back with a link.