Accessing aes() mappings from a scale_ function

I've been trying to write a new scale_ function that automatically sets the breaks to the quantiles for that axis (a la Tufte's rangeframe plots). The main thing I'd like to accomplish is accessing the x and y variables passed to aes() from this new scale_ function. I'll outline the issue more below.

I found a StackOverflow thread that delineated how to make the new scale_ function, which is via the following set of functions:

quantile_breaks <- function(value, prob, digits = 1) {
  function(x) round(as.numeric(quantile(value, prob)), digits = digits)
}

quantile_trans <- function(val, prob, digits) {
  scales::trans_new(
    name = "quantile",
    transform = function(x) x,
    inverse = function(x) x,
    breaks = quantile_breaks(val, prob, digits))
}

scale_x_quantile <- function(val, prob = seq(0, 1, 0.25), digits = 1, ...) {
  scale_x_continuous(..., trans = quantile_trans(val, prob, digits))
}

This works, but you have to specify val by directly referring to the dataframe and column, like so:
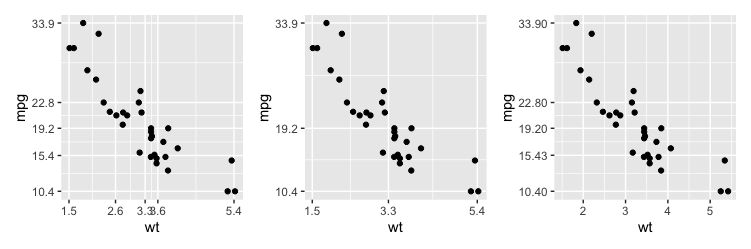
mtcars %>% 
ggplot(aes(x = wt, y = mpg)) + 
geom_point() + 
scale_x_quantile(val = mtcars$wt)

It's clear that the quantiles of the x axis should (probably) always correspond precisely to the column mapped to x in aes(), so I would really like to implement this as a default option. However, it's unclear to me how, or whether it's even possible, to access variables passed to aes() later on. I knowother layers can access these mappings, but I don't know if it's possible for scale_ functions to access them as well. The ultimate goal is to be able to just run + scale_x_quantile() without any further arguments, and it sets the breaks to the quantiles for the x mapping by default.

Is this possible?

1 Like

I think the scale functions only receive the limits, rather than all of the data values (as implied in the help for the breaks argument of the scale functions). For example, if scale_y_continuous received the data values, since the breaks argument can take a function, you could just do scale_y_continuous(breaks=function(x) unname(quantile(x))) and you wouldn't even need a new scale function to generate quantile breaks. But if you run the code in the previous sentence, you'll see that the breaks will be the quantiles you get if you pass the default axis limits to quantile (which is, in fact, what's happening).

For a function that requires the data values to be passed in explicitly, you can instead do (using mtcars as in your example), scale_y_continuous(breaks=round(unname(quantile(mtcars$wt)),1)) to get the desired quantile breaks.

Below is another way to add quantile breaks to a ggplot. It's not much of an improvement, but just my first attempt at a less cumbersome approach. A disadvantage is that you need to save a ggplot object first to feed to the function rather than just adding the quantile breaks on the fly with a + as in the normal ggplot workflow. I'm not sure how to avoid that.

library(tidyverse)

scale_quantile = function(plot, axes=c("x","y"), digits=1, probs=seq(0,1,0.25)) {
  
  xbreaks = list(
    scale_x_continuous(breaks=round(unname(quantile(layer_data(plot)[["x"]], probs=probs)), digits))
  )
  ybreaks = list(
    scale_y_continuous(breaks=round(unname(quantile(layer_data(plot)[["y"]], probs=probs)), digits))
  )
  
  br = list()
  if("x" %in% axes) {
    br = c(br, xbreaks)
  }
  if("y" %in% axes) {
    br = c(br, ybreaks)
  }
  
  return(br)
}

p=mtcars %>%
    ggplot(aes(x = wt, y = mpg)) +
      geom_point( )

p + scale_quantile(p) 
p + scale_quantile(p, probs=c(0,0.5,1)) 
p + scale_quantile(p, "y", 2) 

This topic was automatically closed 21 days after the last reply. New replies are no longer allowed.