Hi, community!
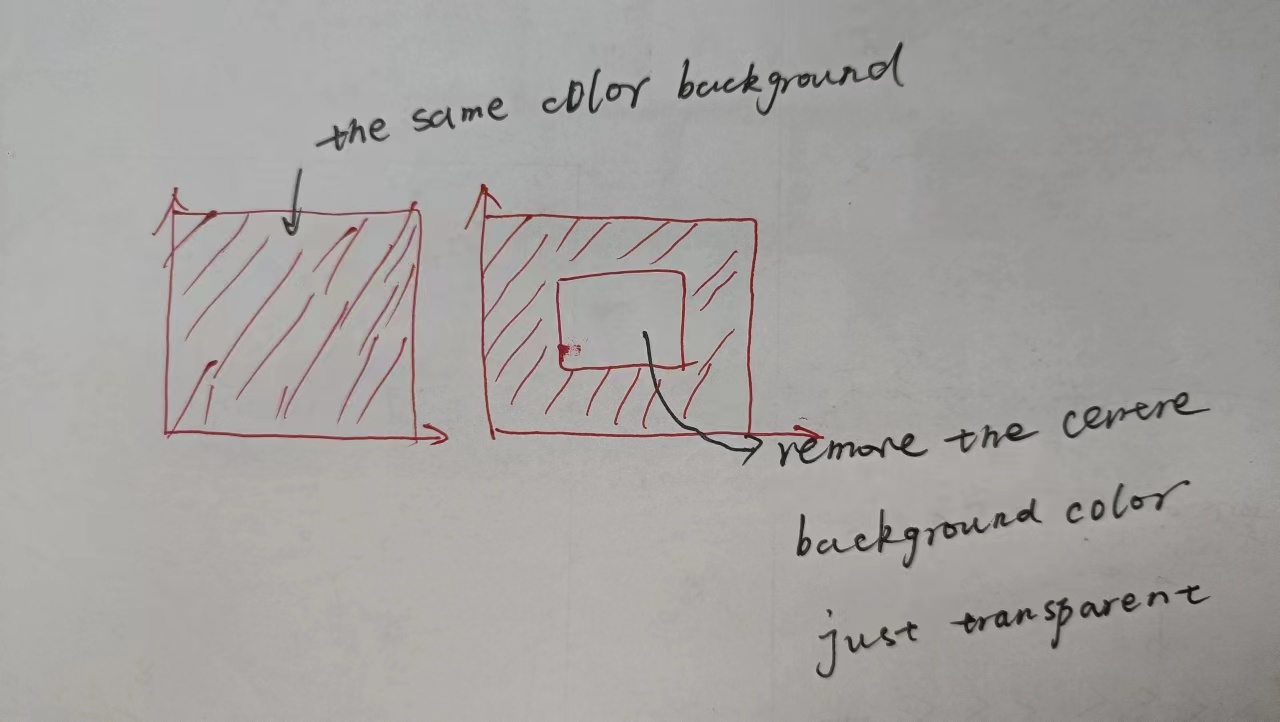
How to remove the background colour of part of a graph in R.
e.g. only the centre area, while leaving the background colour unchanged around it.
What i mean is how just change panel.background color to be transparent, just the centre area of plot.
You colud draw the scatter plot to show your opinion.
Thanks for all the help.
Hi,
Here you have some help:
THEME
MODIFY COMPONENTS
About your case, run this: TRANSPARENT
library(ggthemes)
library(ggplot2)
library(tidyverse)
ee <- data.frame(P = c(sample(LETTERS[1:21], 10, replace = T)),
o = c(sample(1:30000)),
L = c(sample(LETTERS[1:21], 10, replace = T)))
      ee %>% ggplot(aes(x = o, y = L)) + geom_point(aes(x = o, y = L))+
        theme(plot.background = element_rect(fill = "green"))+
        theme(panel.background = element_rect(fill = "transparent", colour = "grey50"))
OR CHANGE THE COLOR TO WHITE
  ee %>% ggplot(aes(x = o, y = L)) + geom_point(aes(x = o, y = L))+
    theme(plot.background = element_rect(fill = "green"))+
    theme(panel.background = element_rect(fill = "white", colour = "grey50"))
1 Like
@bustosmiguel Thank you for your help. But it seems not what the question ask.
OK, Try this:
  ee %>% ggplot(aes(x = o, y = L)) + geom_point(aes(x = o, y = L))+
    theme(panel.background = element_rect(fill = NA))
Or this:
  ee %>% ggplot(aes(x = o, y = L)) + geom_point(aes(x = o, y = L))+
    theme(panel.background = element_rect(fill = "white", colour = "grey50"))
Or search in the internet a plot like you need, and share!
All in all, thank you for your help. I will try based on your opinion.
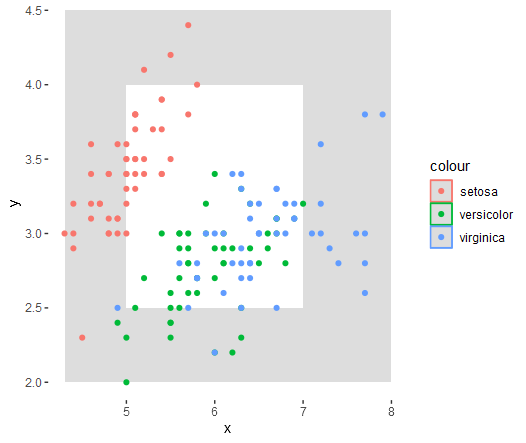
make it transparent and then carefully draw off rectangles to paint over the parts you want to occlude
library(tidyverse)


ggplot() +
  #left side
  geom_polygon(data=data.frame
               (x=c(4.3,5,5,4.3)),
               y=c(2,2,4.5,4.5),
               aes(x=x,y=y,color=NULL,fill=NULL),
               fill="#dddddd")+
  #right side
  geom_polygon(data=data.frame
               (x=c(7,8,8,7)),
               y=c(2,2,4.5,4.5),
               aes(x=x,y=y,color=NULL,fill=NULL),
               fill="#dddddd")+
  #bottom side
  geom_polygon(data=data.frame
               (x=c(4.3,8,8,4.3)),
               y=c(2,2,2.5,2.5),
               aes(x=x,y=y,color=NULL,fill=NULL),
               fill="#dddddd")+
  #top side
  geom_polygon(data=data.frame
               (x=c(4.3,8,8,4.3)),
               y=c(4,4,4.5,4.5),
               aes(x=x,y=y,color=NULL,fill=NULL),
               fill="#dddddd")+
  geom_point(data =
iris,aes(x=Sepal.Length,
                y=Sepal.Width,
                color=Species)) +
  theme(panel.background = element_rect(fill="transparent"))
1 Like
@nirgrahamuk it works!!! thank you for your effort and time in this question.
This topic was automatically closed 7 days after the last reply. New replies are no longer allowed.
If you have a query related to it or one of the replies, start a new topic and refer back with a link.