Hello, everyone, one more question when practicing R.
How could we draw the correlation plot in R, only display one variable with many other variable? And then many groups, with one common legend. Maybe asymmetric correlation heatmap?
Thank you for all the help.
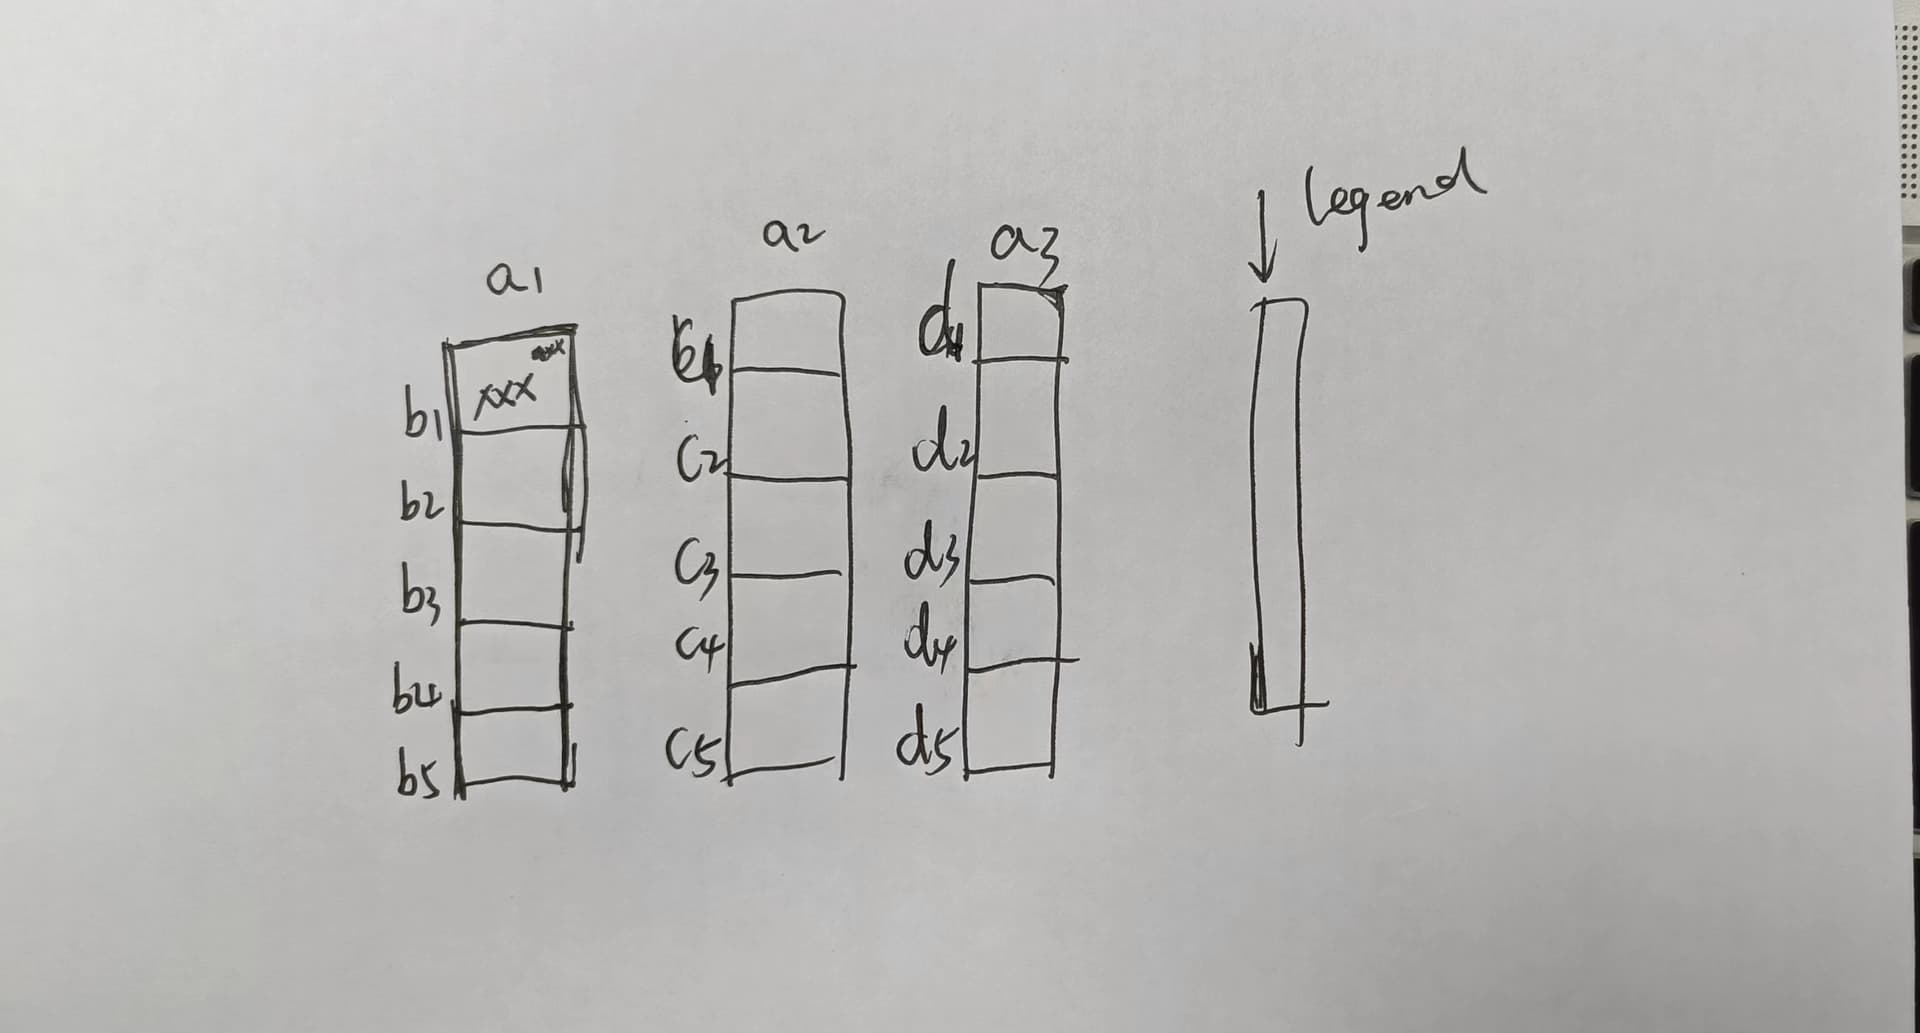
create the multiple plots, make sure they all use the same scale limits; but theme them to hide the scale from all but the one you want to show on the right.
use library patchwork to stitch the plots together horizontally. (other options exists, e.g. cowplot)
Thank you! @nirgrahamuk
What's more how could I draw the corrplot that one variable with many other variables(not Symmetric Matrices) and add the correlation coefficient and significance label at the meantime? I could only draw the Symmetric cor Matrices.
We could use mtcars data in R. To do analysis between mpg and disp, wt, qsec, vs,am, gear, carb(7 variables). The get cor plot that 1 col and 7 rows, that have correlation coefficient and significance label.
This topic was automatically closed 42 days after the last reply. New replies are no longer allowed.
If you have a query related to it or one of the replies, start a new topic and refer back with a link.