Hi, community.
I met another interesting question when practice. I would like to use chi-square goodness-of-fit test to see if the example data is normal distribution. We need know observation value and expected value. How could we get these, especially the expected value. The same for other distribution type, like gamma, weibull? Any help would be appreciated.
If x is a matrix with one row or column, or if x is a vector and y is not given, then a goodness-of-fit test is performed (x is treated as a one-dimensional contingency table). The entries of x must be non-negative integers. In this case, the hypothesis tested is whether the population probabilities equal those in p , or are all equal if p is not given
The {nortest} package provides tests for normality.
library(nortest)
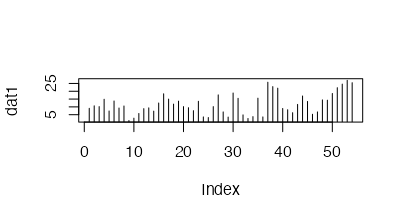
dat1<-c(9.1,10.7,10.2,14.9,7.4,13.8,9.3,10.6,1.3,2.8,5.8,8.9,9.4,7.3,12.5,18.4,15.0,11.8,13.7,10.2,9.5,7.6,13.6,3.6,3.2,10.2,17.7,6.8,3.5,18.9,15.5,4.9,2.6,3.8,15.6,3.6,25.8,23,22,9,8.2,6.3,11.6,17,13.5,5.3,6.8,14.5,14.3,18.6,22.3,24.6,27,25.5)
ad.test(dat1)
#>
#> Anderson-Darling normality test
#>
#> data: dat1
#> A = 0.67384, p-value = 0.0742
# or just eyeball
plot(dat1, type = 'h')
library(goft)
#> Loading required package: fitdistrplus
#> Loading required package: MASS
#> Loading required package: survival
#> Loading required package: sn
#> Loading required package: stats4
#>
#> Attaching package: 'sn'
#> The following object is masked from 'package:stats':
#>
#> sd
normal_test(dat1)
#>
#>  Correlation test for normality
#>
#> data:  dat1
#> R = 0.9937, p-value = 0.04984
#> alternative hypothesis: dat1 does not follow a normal distribution.
gamma_test(dat1)
#>
#>  Test of fit for the Gamma distribution
#>
#> data:  dat1
#> V = -1.2658, p-value = 0.3707
weibull_test(dat1)
#>
#>  Test for the Weibull distribution
#>
#> data:  dat1
#> p-value = 0.786