I am trying to draw an Abline in my graph but it isn't working. how can i figure out the value of a and b. I know that they to do with the intercept. How can i find that out?
It sounds like you're trying to use the abline function from base graphics. In that function a is the intercept and b is the slope of the line that will be drawn (see the help for abline by typing ?abline in the console).
Are you saying you want to figure out what the values of the intercept and slope should be for your particular situation? If so, we'll need some additional information about your problem. Can you provide a reproducible example? That just means code and data that we can work with to reproduce your problem and provide tailored solutions.
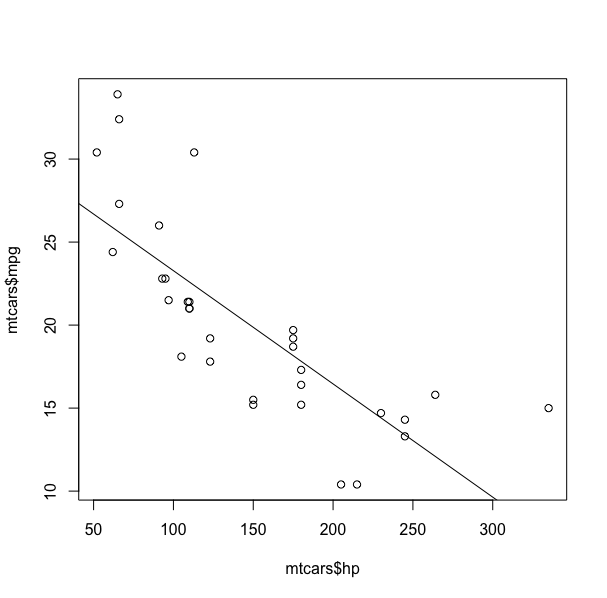
Here's an example using the built-in mtcars data set:
plot(mtcars$hp, mtcars$mpg)

# Model predicting mpg from hp
m = lm(mpg ~ hp, data=mtcars)

# Add regression line to plot using intercept and slope coefficients
#  from the model we just created
abline(a=coef(m)[1], b=coef(m)[2])
2 Likes
That's great Thank You
This topic was automatically closed 7 days after the last reply. New replies are no longer allowed.