A reproducible example, called a reprex -- FAQ: What's a reproducible example (`reprex`) and how do I create one? -- would help here.
So, I'll have to use an example from a standard data set.
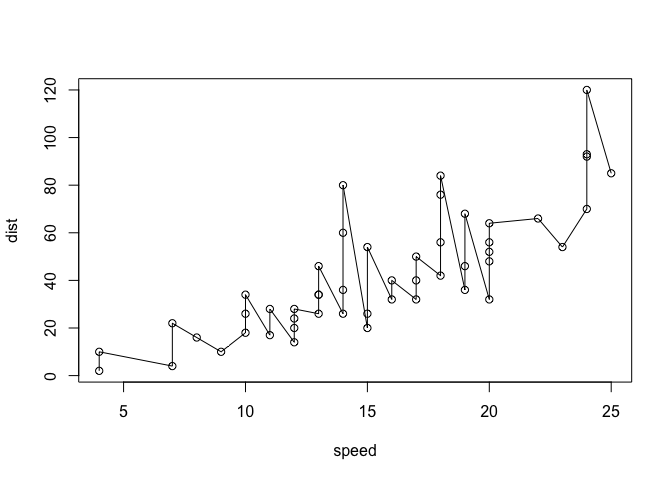
plot(cars) # default is points
lines(cars, type = "l") # overlay line
Created on 2020-01-29 by the reprex package (v0.3.0)
Take a look at the ggplot2 package. Easier to use, more expressive.