A simple boxplot with two means of means and standard deviations

This is my sample data:

x1 <- c(1, 2, 3, 4, 5)
x2 <- c(6, 7, 4, 5, 7)
x3 <- c(4, 5, 3, 7, 1)
x4 <- c(3, 5, 6, 4, 2)
x5 <- c(1, 3, 4, 4, 2)
x6 <- c(4, 5, 4, 3, 5)

df <- data.frame(x1 = x1, x2 = x2, x3 = x3, x4 = x4, x5 = x5, x6 = x6)


df <- df %>% 
  rowwise() %>%
  mutate(
    var1_mean = mean(c(x1, x2, x3)),
    var2_mean = mean(c(x4, x5, x6))
  )

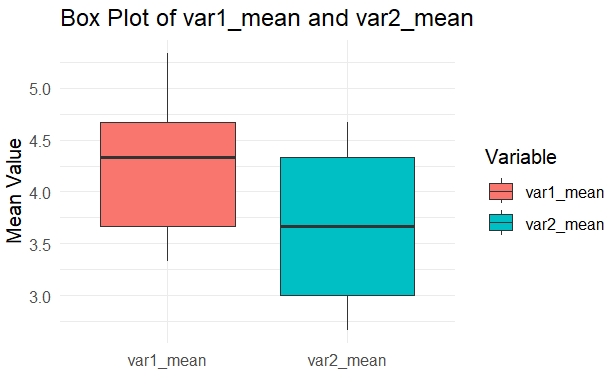
What I want, is a boxplot that shows the mean of var1_mean , including standard deviation, in the first box, and the same thing for var2_mean in the other box. The code below seems to do the job, but I'm not sure because I don't understand this rep function. Could you please clarify this to me?

plot_df <- data.frame(
  Variable = c(rep("var1_mean", nrow(df)), rep("var2_mean", nrow(df))),
  Value = c(df$var1_mean, df$var2_mean)
)

ggplot(plot_df, aes(x = Variable, y = Value, fill = Variable)) +
  geom_boxplot() +
  labs(x = "", y = "Mean Value") +
  ggtitle("Box Plot of var1_mean and var2_mean") +
  theme_minimal()

image

This object is a vector, with two strings, var1_means and var2_means, each repeated a number of times equal to the number of rows in df.

Therefore, the boxplot is really showing what I requested for, the means and stds of the two variables?

is the question that I was answering. To place the means and standard deviations, I would include those as text items because the value of the means is shown in the heavy horizontal line and the values of the standard deviations are less than 1.

library(dplyr)
#> 
#> Attaching package: 'dplyr'
#> The following objects are masked from 'package:stats':
#> 
#>     filter, lag
#> The following objects are masked from 'package:base':
#> 
#>     intersect, setdiff, setequal, union
library(ggplot2)
x1 <- c(1, 2, 3, 4, 5)
x2 <- c(6, 7, 4, 5, 7)
x3 <- c(4, 5, 3, 7, 1)
x4 <- c(3, 5, 6, 4, 2)
x5 <- c(1, 3, 4, 4, 2)
x6 <- c(4, 5, 4, 3, 5)

df <- data.frame(x1 = x1, x2 = x2, x3 = x3, x4 = x4, x5 = x5, x6 = x6)


df <- df %>% 
  rowwise() %>%
  mutate(
    var1_mean = mean(c(x1, x2, x3)),
    var2_mean = mean(c(x4, x5, x6))
  )

plot_df <- data.frame(
  Variable = c(rep("var1_mean", nrow(df)), rep("var2_mean", nrow(df))),
  Value = c(df$var1_mean, df$var2_mean)
)

m1 <- formatC(mean(df$var1_mean,na.rm = TRUE), digits = 3)
m2 <- formatC(mean(df$var2_mean,na.rm = TRUE), digits = 3)
sd1 <- formatC(sd(df$var1_mean,na.rm = TRUE), digits = 2)
sd2 <- formatC(sd(df$var2_mean,na.rm = TRUE), digits = 2)
subtitle = paste("mean of var1_mean =",m1,"and sd =",sd1,
               "& mean of var2_mean =",m2,"and sd =",sd2) 
  
p <- ggplot(plot_df, aes(x = Variable, y = Value, fill = Variable)) +
  geom_boxplot() +
  labs(x = "", y = "Mean Value",
       title = "Box Plot of var1_mean and var2_mean",
       subtitle = subtitle) +
         theme_minimal()
p

Created on 2023-09-26 with reprex v2.0.2

Thank you very much for a great reply @technocrat

1 Like

This topic was automatically closed 7 days after the last reply. New replies are no longer allowed.

If you have a query related to it or one of the replies, start a new topic and refer back with a link.