A (Not So) Simple Reading Tracker
Authors: Sean Fischer
Abstract: My app presents a set of dashboards to help me hit my reading goals. The main pages use interactive graphs to track my progress. I also list what I would like to read (with predictions of how much I will enjoy each book) and what I have read.
Full Description:
Purpose
Over the last few years I have become a bit of an audiobook fanatic. Listening to books on my way to work or while taking car trips helped me to read a lot of books on my to-read list. At the start of this year I set some new reading goals, both in terms of the total amount I would like to read this year, and in terms of the diversity of what I'd like to read.
However, I find it hard to stay on top of how I'm doing with goals like these. One option for actively tracking my behavior was to use Goodreads combined with some set of spreadsheets. But, I found myself unimpressed with what Goodreads offered me and the thought of managing inputs in two different places seemed like a likely source of failure down the road.
Taking these considerations into account, I decided to build a Shiny app to track my progress. A Shiny app seemed like an ideal solution because I could add features, like model predictions, while also pulling in the helpful data from Goodreads and only needing updates in a single place.
Features
The app is built using shinydashboard and has four main pages.
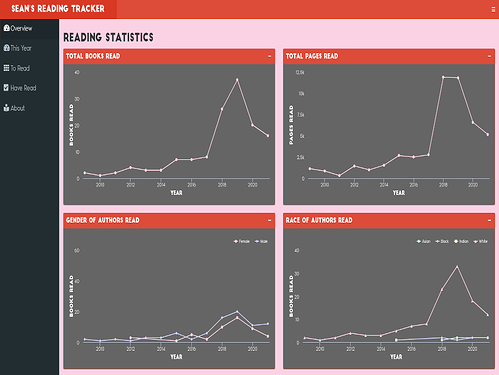
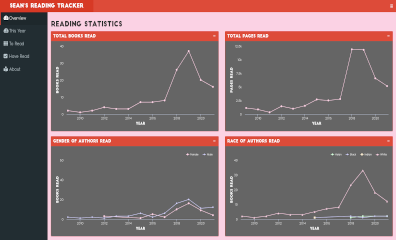
The first page tracks my reading over several years along four dimensions: the total number of books read, the number of pages read, the number of books read by author sex, and the number of books read by author race.
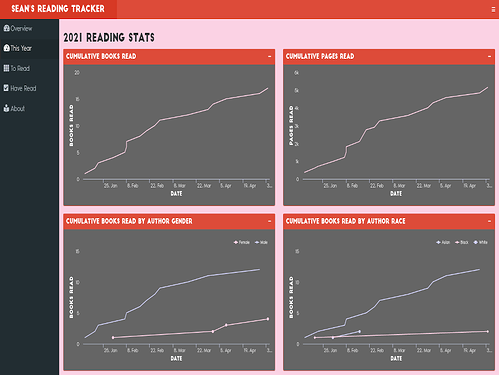
The second page reports these metrics, but tracks them at a higher resolution within the given year.
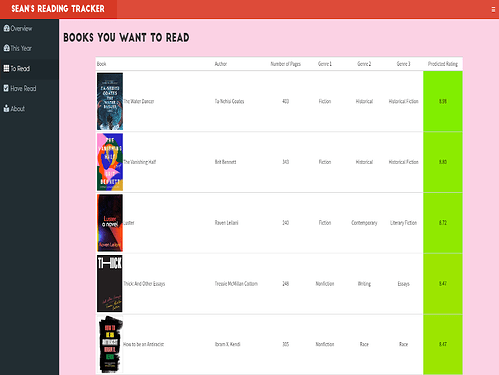
The third page presents my to-read list. This list includes an image of the book cover (because sometimes it is helpful to judge a book by its cover), basic information (e.g. title and author), the number of pages in the book, and the three most commonly assigned genres for the book on Goodreads. Finally, I also include a predicted rating, based on a model trained on the ratings I have already given to my prior reading. This table is color coded and includes a helpful color scale associated with the ratings for fast visual assessment.
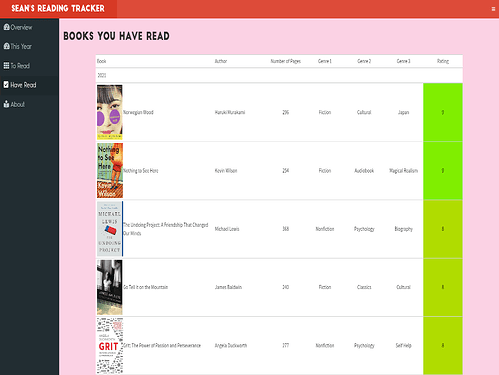
The final page presents the list of books I have read and rated. The list is grouped by year and sorted in descending order by rating. Otherwise, the table contains the same formatting and information in the to-read table.
Implementation
Data
The data behind this app generally come from two spreadsheets I use to record with my to-read and my have-read lists. However, I also scrape some important pieces of data directly from each book's Goodreads page. These include the URL of the book's cover image, the number of pages in the book, and its associated genres.
One cool part about this setup is that people can submit new additions to my to-read list via this Google Form, which I link to on the app's About page. This feature makes it easier for me to solicit recommendations from both close friends and others who I meet online.
Packages
Beyond shinydashboard, I relied heavily on a few essential packages.
-
googlesheets4- My reading lists are stored in Google Sheets for easy updating via Google Forms.googlesheets4allows me to easily pull the latest data into my app when it loads; -
rvest- I need to scrape some important information for each book I want to read and have read.rvestprovides an easy way to integrate these queries into a common tidyverse friendly format. -
gt- The two pages displaying my to-read and have-read lists stand out because they include the book covers and the color-coded rating scales. These are made incredibly easy to implement using the pipe-structure ingt. -
mlr- While the underlying data are not very large, I wanted to develop a model to provide me with information about how much I might enjoy each book on my to-read list. I usedmlrto estimate a random forest model and generate predictions. -
highcharter- With so much of the application being graphics, I wanted to maximize both the amount of information available in the figures and the aesthetic features of the plots. I found that making the figures interactive usinghighcharterwas a very good way to encode a high amount of information, such as yearly reading totals, while not overwhelming the figure with too much text.
Keywords: reading, behavior, diversity, goals, tracking, highcharter, shinydashboard
Shiny app: https://seanafischer.shinyapps.io/reading_app/
Repo: Sean Fischer / reading_app · GitLab
RStudio Cloud: Posit Cloud
Thumbnail:
Full image:
