
I want to draw a a horizontal line at 0 parallel to X-axis.
I looks like you are using the base plotting function so you would use the abline function to add a line to the plot. Using the h parameter adds a horizontal line with the given y intercept.
DF <- data.frame(X = 1:20, Y = runif(n = 20, min = -5, max = 5))
plot(DF$X, DF$Y)
abline(h = 0)
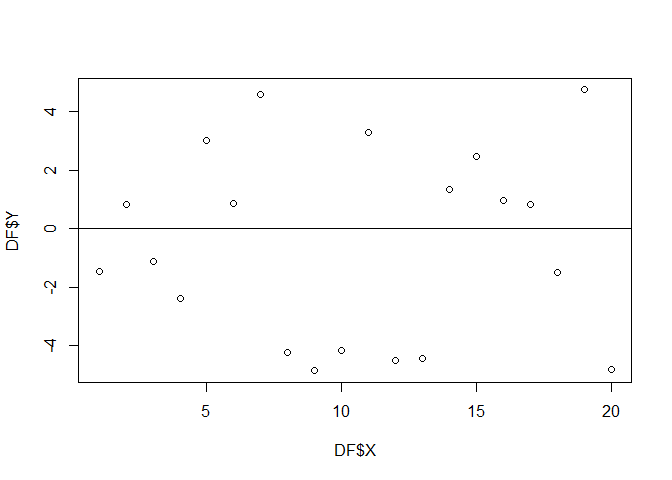
Created on 2020-06-11 by the reprex package (v0.3.0)
1 Like
geom_hline() with yintercept will add horizontal line. https://ggplot2.tidyverse.org/reference/geom_abline.html
1 Like
This topic was automatically closed 7 days after the last reply. New replies are no longer allowed.