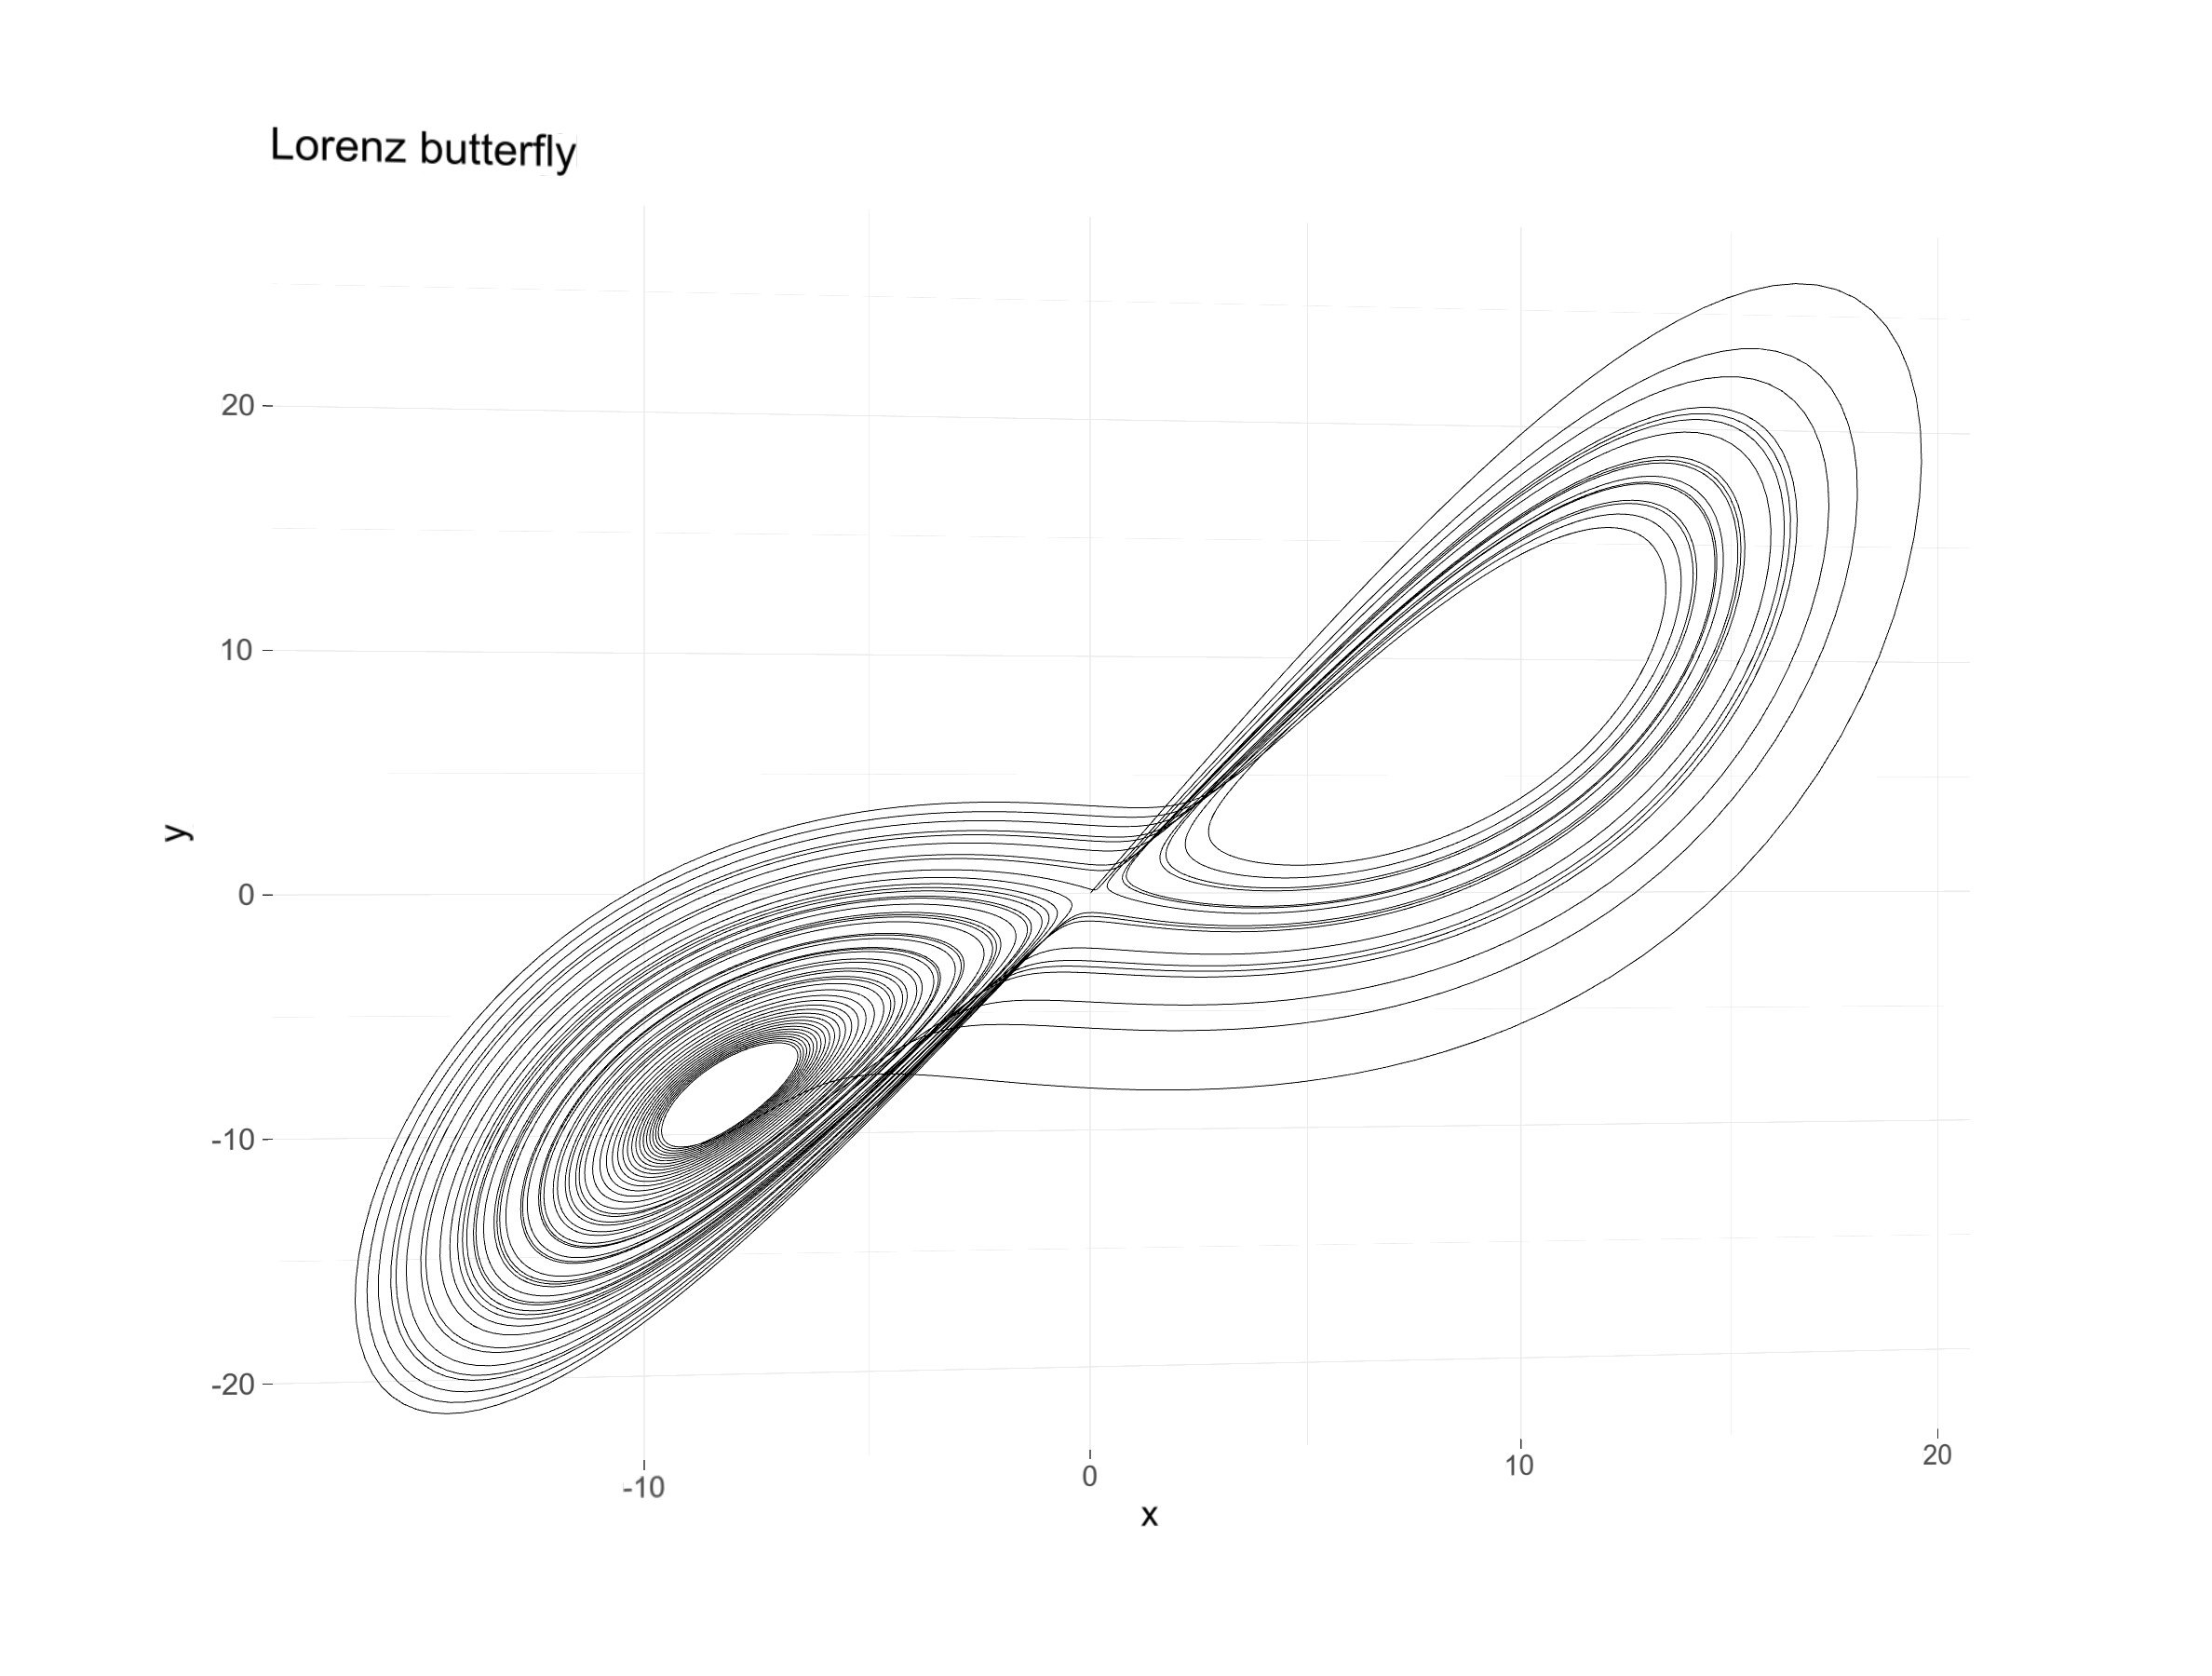
I want to plot multiple solution trajectories of a 3d ODE system. I usually make 2d plots with ggplot2, with which I'm reasonably familiar, and would like to create a theme I could use throughout for both 2d and 3d plots. I'm looking for consistency of look and ability to customize.
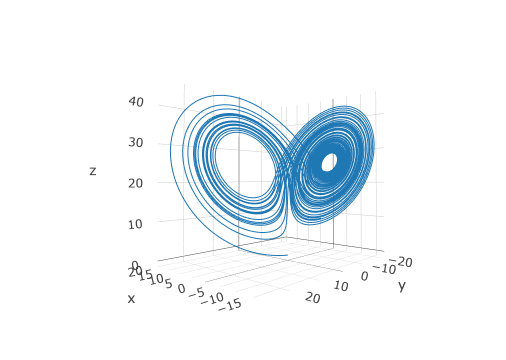
EDIT: Combining ggplot2 and a new/experimental package ggrgl (plus a host of dependencies), I was able to produce the plot below. Is there a better way?
Missing features: not sure how to add the third axis.
One way to embed an rgl scene is to knit an HTML with RMarkdown. Code below:
title: "Lorenz attractor butterflies with ggplot2, rgl, ggrgl,devout,devoutrgl, and webshot2!"
knitr::opts_chunk$set(
  collapse = FALSE,
  comment = "#>",
  fig.width  = 8,
  fig.height = 6,
  dev = 'png'
)
library(deSolve)
library(ggplot2)
library(rgl)
library(ggrgl)
  # remotes('coolbutuseless/ggrgl', ref='main')
library(devout)
library(devoutrgl)
  # remotes('coolbutuseless/devoutrgl', ref='main')
library(webshot2)
  # remotes::install_github("rstudio/webshot2")
# Parameters
parms <- c(a = 10, b = 8/3, c = 26.48)

# Initial state
yini <- c(x = 0.01, y = 0.0, z = 0.0)

# Lorenz system
lorenz <- function(Time, State, Param) {
  with(as.list(c(State, Param)), {
    xdot <- a*(y-x)
    ydot <- x*(c-z)-y
    zdot <- x*y-b*z
    return(list(c(xdot, ydot, zdot)))
  })
}

# Set time horizon
times <- seq(0, 50, by=1/200)

# Make dataframe
df <- as.data.frame(ode(func=lorenz, y=yini, parms=parms, times=times))

# Make plot
ggplot(df, aes(x=x, y=y, z=z)) +
  geom_path_3d() +
  ggtitle("Lorenz butterfly") +
#  scale_colour_viridis_c() +
  theme_ggrgl() -> p

# Render Plot in 3d
rgldev(fov=30, view_angle=-10, zoom=0.7)
p
invisible(dev.off())
# Save plot as PNG
rgldev(fov=30, view_angle=-10, zoom=0.7,
       file = "~/R/lorenz-attractor/lorenz-ggrgl.png",
       close_window = TRUE, dpi = 300)
p
dev.off()