Dear R community,
I am a beginner in the use of R and hope that you can help me. I want to plot a flight 3 D and integrate a map (topography) in the x or y plane. For this purpose, I have imported an excel table with the name "Flugroute" into R. In this table are the columns ID (for the flight number), the latitude, longitude, flight altitude, and the GPS time.
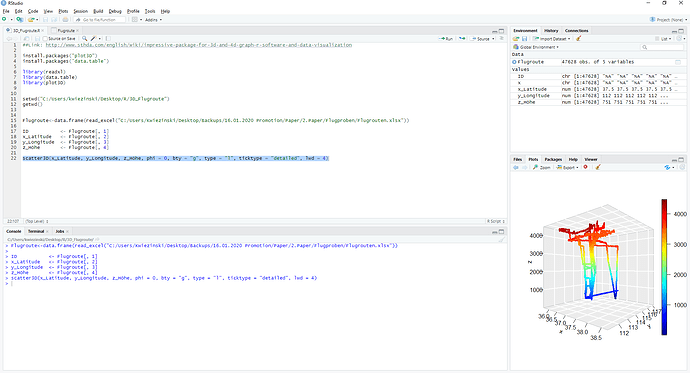
The data from the table were already readout (packages-data.tabl) and from these, a 3-D plot was created (packages-plot3D). However, all flights are displayed in the plot, I want only flights with a certain ID to be displayed. For better understanding:
Flugroute<-data.frame(read_excel("C:/Users/Kwiezinski/Desktop/Backups/16.01.2020 Promotion/Paper/2.Paper/Flugproben/Flugrouten.xlsx"))

ID           <- Flugroute[, 1]
x_Latitude   <- Flugroute[, 2]
y_Longitude  <- Flugroute[, 3]
z_Höhe       <- Flugroute[, 4]

scatter3D(x_Latitude, y_Longitude, z_Höhe, phi = 0, bty = "g", type = "l", ticktype = "detailed", lwd = 4)
I can imagine that the second part (ploting topography) is very complex.
Regardless of this, I would like to thank you already.
Best regards,
Locardas
