> datalist
$A
# A tibble: 10 x 2
        O          G
   <dbl> <chr>
 1     3       A
 2     4       A
 3     4       A
 4     3       A
 5     2       A

$B
# A tibble: 10 x 2
        O      G
   <dbl> <chr>
 1     5       B
 2     5       B
 3     6      B
 4     7      B
 5     4       B
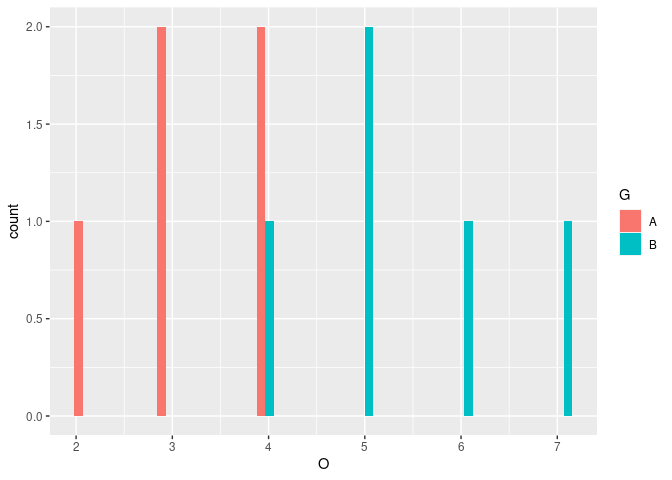
I have created two different datalists by splitting a dataset by "G". I have another datalist where G=B. This is just a subset of the two datalists . I am struggling with something that should be simple. How do I create histograms of each of these datalists together in one frame?