I was wondering if yardstick's vignette could offer some recommendations about whether the grouping should be at repeats level or fold level. I was thinking back to Apples-to-Apples in Cross-Validation Studies: Pitfalls in Classifier Performance Measurement (2010), which notes that scores aren't necessarily comparable across folds, yet many software don't take this into consideration.
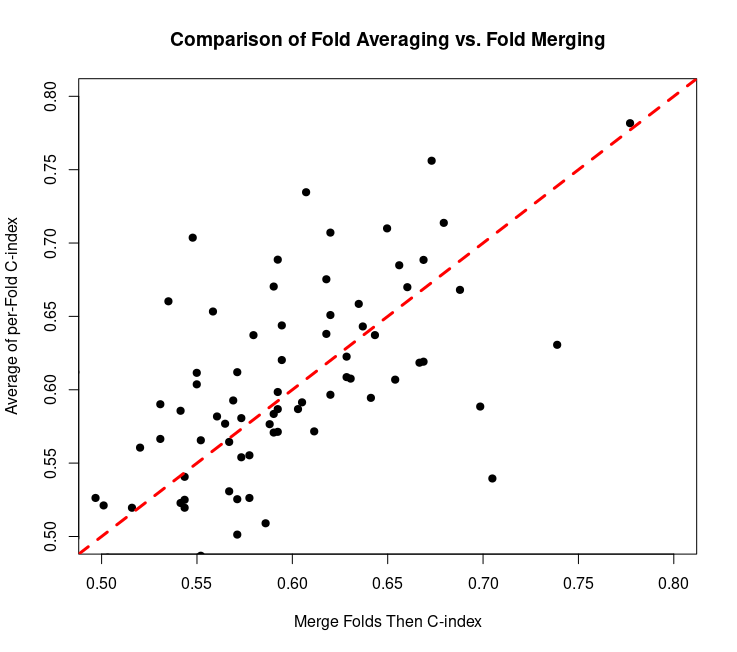
Yes, considering the C-index performance metric of a certain data set with survival times of samples, it is evident that index values are typically smaller if the risk scores from all five folds are merged and the C-index calculated for all samples rather than the C-index calculated in each test fold and then averaged for all folds of each cross-validation repeat. Each dot in the scatter plot is one cross-validation repeat. There are more dots above the dashed red line than there are below it.
1 Like
Can you please provide a minimal reprex (reproducible example)? The goal of a reprex is to make it as easy as possible for me to recreate your problem so that I can fix it: please help me help you!
If you've never heard of a reprex before, start by reading "What is a reprex", and follow the advice further down that page.
Generally, we don't advise pooling data across resampling and computing metrics. I've rarely seen that in the literature. In tidymodels, we use their "avg" estimator (and not the merged version). that is pretty explict in the output of tidymodels functions.
Also, metric sets are group-aware:
library(tidymodels)
library(censored)
#> Loading required package: survival

data("mlc_churn")

mlc_churn <-
  mlc_churn %>%
  mutate(
    churned = ifelse(churn == "yes", 1, 0),
    event_time = Surv(account_length, churned)
  )

set.seed(6941)
churn_split <- initial_split(mlc_churn)
churn_tr <- training(churn_split)
churn_te <- testing(churn_split)
churn_rs <- vfold_cv(churn_tr)

mod_res <-
  survival_reg() %>%
  fit_resamples(
    event_time ~ account_length + number_vmail_messages,
    resamples = churn_rs,
    control = control_resamples(save_pred = TRUE),
    metrics = metric_set(concordance_survival, brier_survival),
    eval_time = 1)


mod_res %>%
  collect_predictions() %>%
  group_by(id) %>%
  concordance_survival(event_time, estimate = .pred_time)
#> # A tibble: 10 × 4
#>    id     .metric              .estimator .estimate
#>    <chr>  <chr>                <chr>          <dbl>
#>  1 Fold01 concordance_survival standard       0.989
#>  2 Fold02 concordance_survival standard       0.983
#>  3 Fold03 concordance_survival standard       0.994
#>  4 Fold04 concordance_survival standard       0.991
#>  5 Fold05 concordance_survival standard       0.984
#>  6 Fold06 concordance_survival standard       0.988
#>  7 Fold07 concordance_survival standard       0.989
#>  8 Fold08 concordance_survival standard       0.984
#>  9 Fold09 concordance_survival standard       0.986
#> 10 Fold10 concordance_survival standard       0.983
Created on 2024-06-19 with reprex v2.1.0
Thank you for the example and advice. My question essentially is if we specified churn_rs <- vfold_cv(churn_tr, repeats = 2) would it be more theoretically sound to do group_by(id) or group_by(id, id2) for the metric summarisation?
This topic was automatically closed 90 days after the last reply. New replies are no longer allowed.
If you have a query related to it or one of the replies, start a new topic and refer back with a link.