I've adapted some code from several public Tidymodels examples to setup an XGBoost model with hyperparameter tuning:
      # ____________________________________
      #Set up the model specification
      #The hyperparameters will be tuned
      xgb_spec <-
        boost_tree(
        trees = 1000,
        tree_depth = tune(),
        min_n = tune(),
        loss_reduction = tune(),
        sample_size = tune(),
        mtry = tune(),
        learn_rate = tune()) %>%
        set_engine("xgboost") %>%
        set_mode("regression")
      #____________________________________


      #____________________________________
      #Set up a space-filling grid design to cover the hyperparameter space as well as possible
      xgb_grid <-
        grid_latin_hypercube(
        tree_depth(),
        min_n(),
        loss_reduction(),
        sample_size = sample_prop(),
        finalize(mtry(), training_set), #gets treated differently b/c it depends on actual # of predictors in data
        learn_rate(),
        size = 40)
      #____________________________________
I understand that the grid_latin_hypercube here is supposed to use LHS to explore the hyperparameter space efficiently/uniformly, but I was confused to see that sample_size() is sampled over a range of ~0.1 to ~0.99, and loss_reduction from 1.5e-10 to ~2.
When plotting the 6 parameters' values across each of the 40 tested configurations, this is clear:
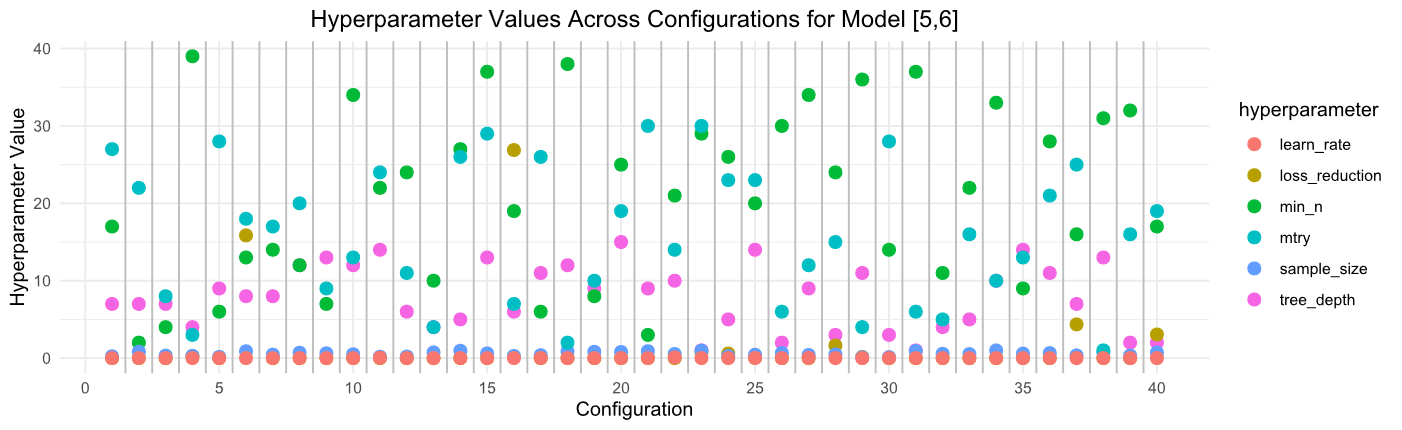
(ignore model name)
Is this as expected? Is this simply a function of not being able to put different parameters on the same scale, and if so, why are some sampled on different scales?
Thanks!