UPDATE: I've uninstalled RStudio 2024.04.0,735 and reinstalled 2023.12.1,402 and can confirm that, without any other changes, this problem goes away. Based on that, I've logged a bug here:
RStudio 2024.04.0,735 Chunk Parsing Issue... · Issue #14684 · rstudio/rstudio · GitHub
I've been fighting this for 1.5 days now and am at my wit's end. I really hope the following is enough to help and not so much to overwhelm. Please let me know if I can do more to help pinpoint the issue.
I've been successfully working on a Quarto book project (dissertation) in RStudio for several months now, without any issues. After updating to the versions listed below, RStudio refuses to run a chunk in one of my documents. When I try to run the offending chunk, nothing at all happens. I get no errors, no output, nothing. It also refuses to run all chunks, run above chunks, etc. Somewhere in the fight I realized that the following is getting added to my rsession log file each time:
2024-05-09T00:11:46.233228Z [rsession-djo] ERROR CLIENT EXCEPTION (rsession-djo): (TypeError) : Cannot read properties of null (reading 'row');|||org/rstudio/studio/client/workbench/views/source/editors/text/TextEditingTargetScopeHelper.java#110::getSweaveChunkInnerRange|||org/rstudio/studio/client/workbench/views/source/editors/text/TextEditingTarget.java#6495::execute|||org/rstudio/studio/client/workbench/views/source/editors/text/TextEditingTarget.java#6484::executeSweaveChunk|||org/rstudio/studio/client/workbench/views/source/editors/text/TextEditingTarget.java#6124::executeChunk|||org/rstudio/studio/client/workbench/views/source/editors/text/rmd/ChunkContextCodeUi.java#81::runChunk|||org/rstudio/studio/client/workbench/views/source/editors/text/rmd/ChunkContextToolbar.java#172::onBrowserEvent|||com/google/gwt/user/client/DOM.java#1432::dispatchEvent|||com/google/gwt/user/client/impl/DOMImplStandard.java#317::dispatchEvent|||com/google/gwt/core/client/impl/Impl.java#296::apply|||com/google/gwt/core/client/impl/Impl.java#335::entry0|||rstudio-0.js#-1::eval|||Client-ID: 33e600bb-c1b1-46bf-b562-ab5cba070b0e|||User-Agent: Mozilla/5.0 (Macintosh Intel Mac OS X 10_15_7) AppleWebKit/537.36 (KHTML, like Gecko) RStudio/2024.04.0+735 Chrome/120.0.6099.291 Electron/28.2.6 Safari/537.36
Additionally, I get the following errors in the dev console after doing "Restart R and Clear Output":
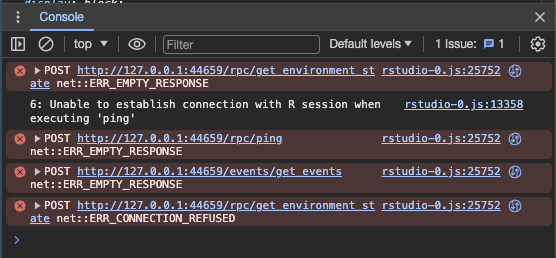
The same file runs / builds fine when using quarto to render to HTML or PDF (from the command line or rendering in RStudio), and it even works in VS Code after I got the quarto environment setup there.
I've included the best I can do re: minimal reproducible case below. When I open this file in a clean RStudio session (with no packages configured, etc.) and choose "Run All", it does nothing except log the error above. At least it should start running the first chunk and complain about the lack of packages. It does not. I've not been able to reliably reduce the code in this file further, but the result is 100% reproducible in my environment:
- Start RStudio
- Create a new QMD file
- Paste the contents below into the file.
- Select Run All Chunks
- Nothing happens.
When the libraries and data are available, the chunk that refuses to run is fig-s1-progress.
# Results {#25-results}

```{r load-libs}
#| message: false

library(tidyverse)
library(readxl)
```

```{r load-data}

car_results <- read_xlsx(
  "./data/combined_results.xlsx",
  na = c("", "N/A"),
  sheet = "car results"
)

demographics <- read_xlsx(
  "./data/combined_results.xlsx",
  na = c("", "N/A"),
  sheet = "demographics"
)
```

```{r def-cust-theme}
base_color <- "#69b3a2"

# Define a custom theme for ggplot
custom_theme <- function() {
  theme_minimal(base_size = 10) +
    theme(
      plot.title.position = "plot",
      plot.title = element_text(face = "bold"),
      # plot.subtitle = element_text(face = "italic"),
      # plot.caption = element_text(color = "grey50"),
      # axis.title.x = element_text(face = "bold"),
      # axis.title.y = element_text(face = "bold"),
      # axis.text = element_text(color = "black"),
      # axis.line = element_line(color = "grey80"),
      # legend.position = "bottom",
      # legend.background = element_rect(fill = "white", colour = "grey50"),
      # legend.key = element_rect(fill = "white", colour = "grey50"),
    )
}

# Set the custom theme as the default theme
theme_set(custom_theme())
```

```{r study-metadata}

participant_count <- demographics |>
  pull(participant) |>
  n_distinct()

# Convert the trial_datetime to Date type
demographics <- demographics |>
  mutate(
    trial_date = as.Date(
      as.POSIXct(trial_datetime, format = "%Y-%m-%d %H:%M:%S")
    )
  )

# Get the first and last date
first_trial_date <- demographics |>
  summarize(first_date = min(trial_date)) |>
  pull(first_date)

last_trial_date <- demographics |>
  summarize(last_date = max(trial_date)) |>
  pull(last_date)

trial_start_str <- str_glue(
  "{month(first_trial_date)}/{day(first_trial_date)}"
)
trial_end_str <- str_glue(
  "{month(last_trial_date)}/{day(last_trial_date)}"
)
trial_year_str <- str_glue("{year(last_trial_date)}")

# start, end = Feb 10, Apr 27 2023
```


```{r fig-s1-progress}
#| fig-cap: "Daily Trial Administration and Completion Percentage"
#| fig-height: 4

# Count experiments per day
daily_counts <- demographics |>
  group_by(trial_date) |>
  summarize(daily_count = n()) |>
  arrange(trial_date)

# Calculate the cumulative count of experiments
daily_counts <- daily_counts |>
  mutate(cumulative_count = cumsum(daily_count))

# Calculate remaining experiments
daily_counts <- daily_counts |>
  mutate(
    percentage_complete = (cumulative_count / participant_count) * 100
  )

pc_eng <- as.character(english::english(participant_count))
pc_eng <- str_replace(pc_eng, "^.", str_to_upper)
subtitle <- str_glue("{pc_eng} Learning and Recall Experiments Conducted between {trial_start_str} and {trial_end_str} of {trial_year_str}")

# Plotting
ggplot(daily_counts, aes(x = trial_date)) +
  geom_line(
    aes(y = daily_count, group = 1),
    color = base_color,
    linewidth = 1,
    alpha = 0.5
  ) +
  geom_line(
    aes(y = percentage_complete, group = 1),
    color = base_color,
    linewidth = 1.25,
    alpha = 1
  ) +
  scale_y_continuous(
    name = "Trials Administered",
    sec.axis = sec_axis(~., name = "Percentage Complete"),
    position = "right",
    limits = c(0, 100)
  ) +
  labs(
    title = "First Session Progress",
    subtitle = subtitle,
    x = element_blank(),
    y = element_blank()
  ) +
  custom_theme()
```


::: content-hidden
TODO: complete above paragraph about second session.
:::

::: content-hidden
MAYBE: perform analysis to evaluate differences between pilot and main group

Pilot Study Comparison
- Compare the key measures (e.g., performance, workload, usability) between the pilot study (n=8) and main study (n=54) participants
- Use descriptive statistics and visualizations to present these comparisons
- Discuss any notable similarities or differences between the two groups

Statistical Power and Sample Size Considerations
- Present the results of statistical power analyses based on the observed effect sizes and the planned statistical tests
- Discuss the adequacy of the sample size for detecting meaningful effects
- Consider the potential impact of including or excluding the pilot study data on the statistical power and precision of the estimates
- sample size calculation / justification: power analysis, practical considerations, precedent

Decision on Pilot Study Inclusion
- Based on the findings from 5.2.3 and 5.2.4, make a decision on whether to include the pilot study data in the main analysis
- Clearly report your decision and rationale, considering factors such as data comparability, study design modifications, and statistical power
:::

```{r drop-pilot-data}
# drop participants in pilot study (first eight)
demographics <- demographics |>
  filter(!(participant >= 1001 & participant <= 1010))

# drop event data from the pilot study
car_results <- car_results |>
  filter(!(participant >= 1001 & participant <= 1010))
```

```{r def-to-factors}

# safely convert data to ord / cat factors
# create levels / labels as required and identify / warn about mismatches

to_factors <- function(
    column,
    levels = NULL,
    labels = NULL,
    ordered = FALSE) {
  if (is.null(levels)) {
    levels <- unique(na.omit(column))
  }

  if (is.null(labels)) {
    labels <- levels
  }

  mismatched <- setdiff(unique(na.omit(column)), levels)

  if (length(mismatched) > 0) {
    # Append mismatched values to levels and labels with a specific prefix
    bad_levels <- paste("Bad -", mismatched)
    levels <- c(levels, mismatched)
    labels <- c(labels, bad_levels)
    warning(
      "Mismatched or unexpected values incorporated: ",
      paste(bad_levels, collapse = ", ")
    )
  }

  # Proceed to convert to factor using cleaned-up data
  factor_column <- factor(column,
    levels = levels, labels = labels,
    ordered = ordered
  )

  return(factor_column)
}
```
I'm using the latest of everything:
- RStudio 2024.04.0+735
- R 4.4.0
- Quarto 1.4.554
- all packages up to date
I've tried all manner of things, including:
- trimming back the qmd file, pasting it into a new document, turning on / off sections, changing chunk options
- switching from rmarkdown style chunk settings
{r fig-something ...}to quarto style#| fig-somethingand back - reset RStudio options
- reinstalling R, RStudio, and Quarto with brew after uninstalling with the same and confirming all cruft was removed including user and system level config files and org.R-project.org cache. after reinstall I used
renv::repairto restore the package state - Attempted to create a minimal reproducible example but faced difficulties due to the intermittent nature and specific context in which the error occurs.
I strongly suspect there is an obscure issue with RStudio's parsing of code blocks, and that it was introduced recently. I ran the same code before the update without issue. Or I'm an idiot and overlooking something really, really obvious. But my buddy Chet (ChatGPT) probably would have pointed that out.
I run almost exclusively in Source mode, because of Visual mode's tendency to reformat everything.
Here is some related info:
> sessionInfo()
R version 4.4.0 (2024-04-24)
Platform: x86_64-apple-darwin20
Running under: macOS Sonoma 14.3.1

Matrix products: default
BLAS:   /System/Library/Frameworks/Accelerate.framework/Versions/A/Frameworks/vecLib.framework/Versions/A/libBLAS.dylib
LAPACK: /Library/Frameworks/R.framework/Versions/4.4-x86_64/Resources/lib/libRlapack.dylib;  LAPACK version 3.12.0

locale:
[1] en_US.UTF-8/en_US.UTF-8/en_US.UTF-8/C/en_US.UTF-8/en_US.UTF-8

time zone: America/Chicago
tzcode source: internal

attached base packages:
[1] stats     graphics  grDevices datasets  utils     methods   base

loaded via a namespace (and not attached):
[1] compiler_4.4.0    tools_4.4.0       rstudioapi_0.16.0 yaml_2.3.8        english_1.2-6
[6] renv_1.0.7

> renv::status()
No issues found -- the project is in a consistent state.