Problem with "<" symbol when building table with KableExtra

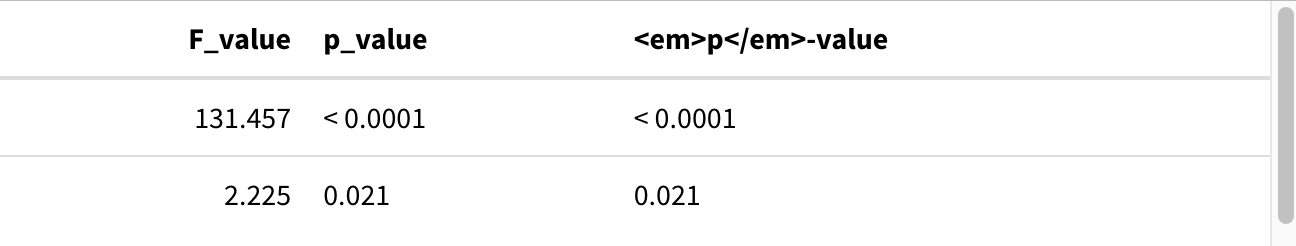
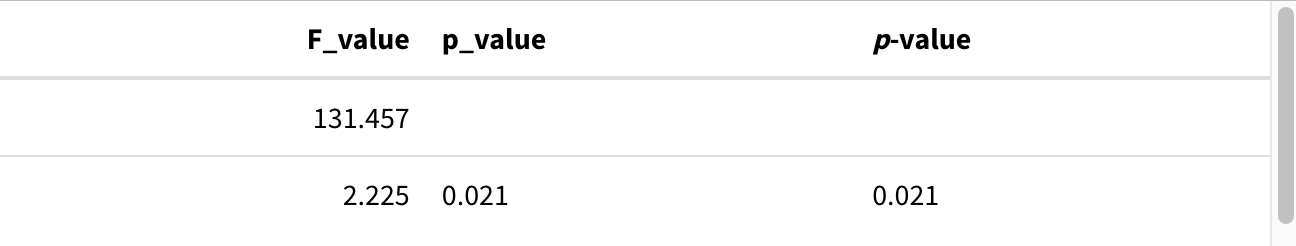
I want to build a table that has html code to show emphasis for a column heading. Some values in the column contain the "<" symbol. I am only able to either show the emphasis on the column heading without the values or show the values in the column without the column heading formatted correctly, but not both.

Below is a reproducible example to illustrate and I have attached two images to show how the table output changes if escape = TRUE, which is the default behavior compared to escape = FALSE`. Does anyone have any suggestions. Thanks!

library(tidyverse)
library(kableExtra)

p_thresh <- 0.0001

df <- tibble::tribble( ~ F_value, ~ p_value, 131.4569, 0, 2.2247, 0.0206) |>
    mutate_if(is.numeric, round, 3) |>
    mutate(
        p_value = ifelse(p_value < p_thresh, (paste(
            "<", format(p_thresh, scientific = FALSE)
        )), p_value),
        '<em>p</em>-value' = as.character(p_value)
    )

table_df <- df |>
    kbl(
        format = "html",
        escape = FALSE # comment/uncomment this line to see different behavior
    ) |> 
    kable_styling() 

table_df

table with escape = TRUE

table with escape = FALSE

I failed to mention the code does not seem to work on a Mac, while the code did run on a windows machine. See version info.

R version 4.4.1 (2024-06-14)
Platform: aarch64-apple-darwin20
Running under: macOS Sonoma 14.6.1

Hi @kbalkcom, thank you for your question and the helpful reprex. I can repeat the behaviour you're seeing - works on Windows but not on Mac.

How would you feel about using gt() to handle the table display instead of kable()?

Here I keep df simple, without markdown or rounding then pass to gt() to handle the display. Specifically:

  • sub_small_vals() to handle the display of a numbers bigger than 0 but less than threshold,
  • sub_zero() to handle dispay of zero numbers,
  • cols_label() to format the column header
library(tidyverse)
library(gt)

df <- tibble::tribble( ~ F_value, ~ p_value, 131.4569, 0, 2.2247, 0.0206)
df |> 
  gt::gt() |> 
  gt::sub_small_vals(columns = p_value, threshold = 0.0001) |> 
  gt::sub_zero(columns = p_value, zero_text = '<0.0001') |> 
  gt::cols_label(p_value = gt::md('*p*-value'))
F_value p-value
131.4569 <0.0001
2.2247 0.0206

Created on 2024-09-18 with reprex v2.1.0

Thank you for the suggestion. Can gt handle two variables as below? I need to be able to show the same header values for different variables. You solution does work, but I don't know how to deal with two variables that have the same subheader values in gt.

library(tidyverse)
library(gt)

df <- tibble::tribble( ~ F_value, ~ p_value, 131.4569, 0, 2.2247, 0.0206)

df2 <- tibble::tribble(~ F_value, ~ p_value, 3.45, 0.0304, 142.069, 0)

test_table <- cbind(df, df2) |> 
    gt::gt() |> 
    gt::sub_small_vals(columns = p_value, threshold = 0.0001) |> 
    gt::sub_zero(columns = p_value, zero_text = '<0.0001') |> 
    gt::cols_label(p_value = gt::md('*p*-value'))

Sure, @kbalkcom.

gt() expects unique column names to be passed, so here I've used the clean_names() function from the janitor package to do this (it adds _2 to the variable names in df2).

How does this work for you?

library(tidyverse)
library(gt)
library(janitor)

df <- tibble::tribble( ~ F_value, ~ p_value, 131.4569, 0, 2.2247, 0.0206)
df2 <- tibble::tribble(~ F_value, ~ p_value, 3.45, 0.0304, 142.069, 0)

cbind(df, df2) |> 
  janitor::clean_names() |> 
  gt::gt() |> 
  gt::sub_small_vals(columns = c(p_value, p_value_2), threshold = 0.0001) |> 
  gt::sub_zero(columns = c(p_value, p_value_2), zero_text = '<0.0001') |> 
  gt::cols_label(
    p_value = gt::md('*p*-value'),
    p_value_2 = gt::md('*p*-value'),
    f_value = 'F-value',
    f_value_2 = 'F-value'
  )
F-value p-value F-value p-value
131.4569 <0.0001 3.450 0.0304
2.2247 0.0206 142.069 <0.0001

Created on 2024-09-19 with reprex v2.1.0

I had heard of gt() and janitor(), but I never used either one. Thank you for the help.

You can see I added spanner labels. I had to use the columns option instead of spanners because I did not know how to handle that with the current headers having the same text for each variable. Perhaps you know a better way.

I was so accustomed to kableExtra, so I am glad to have a different option. Not sure why my original code would not work on the Mac, but would work on Windows, but you solved the problem with a more straight-forward approach.

I need to incorporate this into my workflow which includes a Quarto document that I use to produce a Word document. I am anxious to see how the table output looks in that format. I will let you know.

library(tidyverse)
library(gt)
library(janitor)

df <- tibble::tribble( ~ F_value, ~ p_value, 131.4569, 0, 2.2247, 0.0206)
df2 <- tibble::tribble(~ F_value, ~ p_value, 3.45, 0.0304, 142.069, 0)

test_table <- cbind(df, df2) |>
    janitor::clean_names() |>
    gt::gt() |>
    gt::sub_small_vals(columns = c(p_value, p_value_2), threshold = 0.0001) |>
    gt::sub_zero(columns = c(p_value, p_value_2), zero_text = '<0.0001') |>
    gt::tab_spanner(label = "Variable 1", columns = c("f_value", "p_value")) |>
    gt::tab_spanner(label = "Variable 2",
        columns = c("f_value_2", "p_value_2")) |>
    gt::cols_label(
        f_value = 'F-value',
        p_value = gt::md('*p*-value'),
        f_value_2 = 'F-value',
        p_value_2 = gt::md('*p*-value')
    ) 

1 Like

This looks great, @kbalkcom. Congratulations.
Hope the Quarto > Word workflow works for you :crossed_fingers:

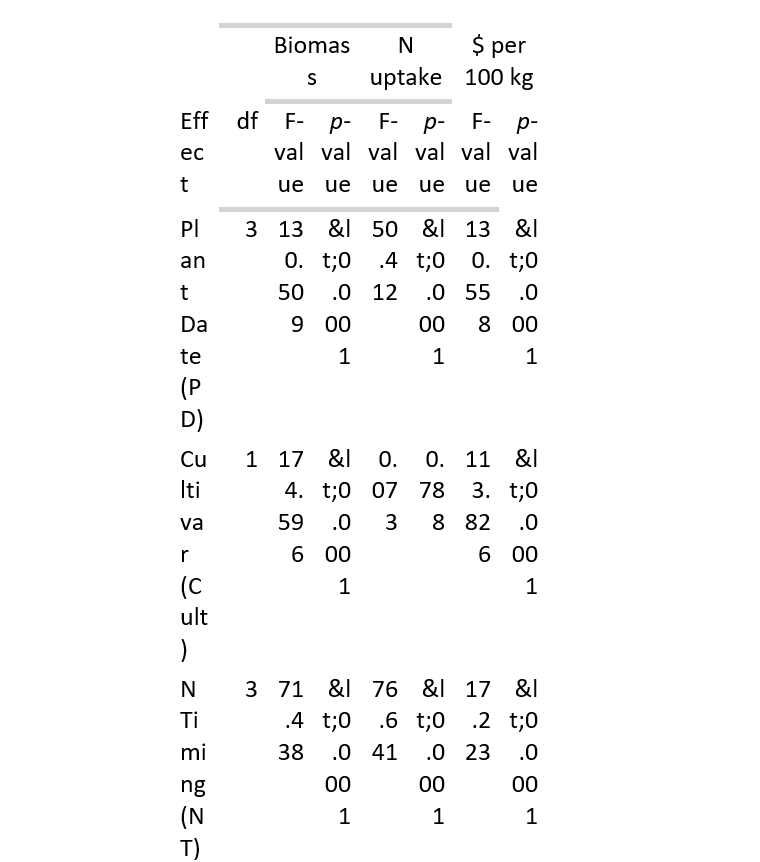
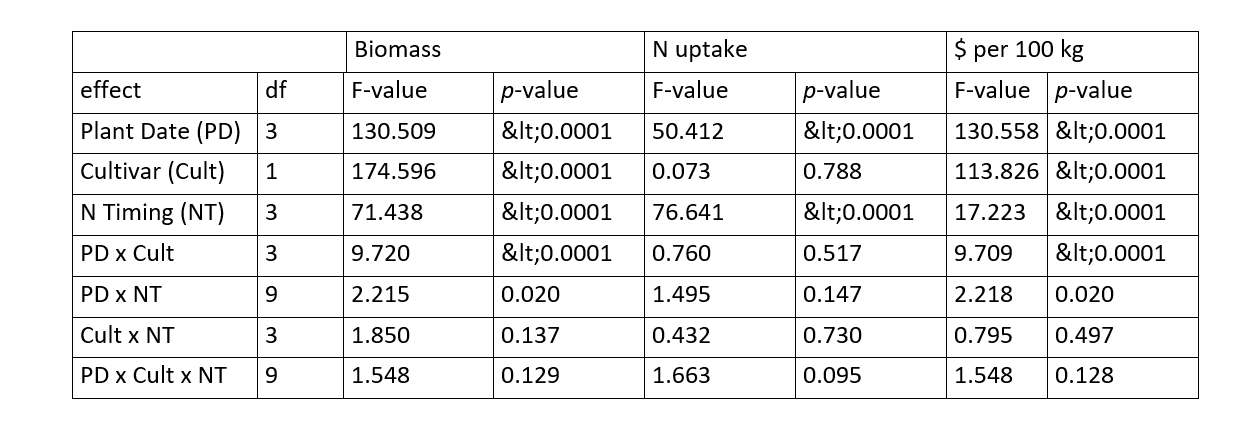
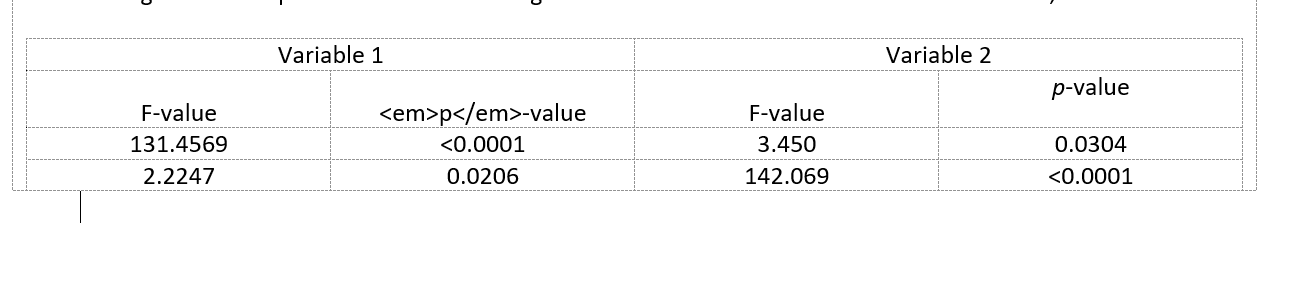
This is the table I ultimately wanted to make. It looked great in RStudio, but the rendered version in Word is shown in the screen shot below. You can format it (second screenshot), but that seems to defeat the purpose if that much work is required. The "<" is also still not presenting correctly.

I am not familiar enough with gt() so maybe this is all correctable. Do you have any ideas? Otherwise, I will study and may need to put in another post or go back to KableExtra with a windows computer. Thank you for getting me this far.

Hi @kbalkcom, thank you for the update.
I get similar dissappointing outputs when exporting to Word - either directly from the gt() object using as gt::as_word() or by embedding in a Quarto doc renders as Word format.

I had some success with gt::as_raw_html(); not perfect but passable maybe?

df <- tibble::tribble( ~ F_value, ~ p_value, 131.4569, 0, 2.2247, 0.0206)
df2 <- tibble::tribble(~ F_value, ~ p_value, 3.45, 0.0304, 142.069, 0)

cbind(df, df2) |>
  janitor::clean_names() |>
  gt::gt() |>
  gt::sub_small_vals(columns = c(p_value, p_value_2), threshold = 0.0001) |>
  gt::sub_zero(columns = c(p_value, p_value_2), zero_text = "<0.0001") |>
  gt::tab_spanner(label = "Variable 1", columns = c("f_value", "p_value")) |>
  gt::tab_spanner(label = "Variable 2",
                  columns = c("f_value_2", "p_value_2")) |>
  gt::cols_label(
    f_value = 'F-value',
    p_value = gt::md('*p*-value'),
    f_value_2 = 'F-value',
    p_value_2 = gt::md('*p*-value')
  ) |> 
  gt::as_raw_html()

Thanks. I was able to produce the table output using your suggestion, but where markdown was used, the alignment in the row is off. (screenshot below). I thought the markdown code could be creating an error, so I tried html for the emphasis, but it did not recognize that. As a last resort, the markdown code can be removed and emphasis added manually in word.

df <- tibble::tribble( ~ F_value, ~ p_value, 131.4569, 0, 2.2247, 0.0206)
df2 <- tibble::tribble(~ F_value, ~ p_value, 3.45, 0.0304, 142.069, 0)

test_table <- cbind(df, df2) |>
    janitor::clean_names() |>
    gt::gt() |>
    gt::sub_small_vals(columns = c(p_value, p_value_2), threshold = 0.0001) |>
    gt::sub_zero(columns = c(p_value, p_value_2), zero_text = '<0.0001') |>
    gt::tab_spanner(label = "Variable 1", columns = c("f_value", "p_value")) |>
    gt::tab_spanner(label = "Variable 2",
        columns = c("f_value_2", "p_value_2")) |>
    gt::cols_label(
        f_value = 'F-value',
        p_value = '<em>p</em>-value',
        f_value_2 = 'F-value',
        p_value_2 = gt::md('*p*-value')
    ) |>
    gt::as_raw_html() 

How weird? :slight_smile:

In that case, I'd suggest wrapping the column labels in either gt::md() or gt::html() to get them vertically aligned. Either all html:

gt::cols_label(
    f_value = gt::html('F-value'),
    p_value = gt::html('<em>p</em>-value'),
    f_value_2 = gt::html('F-value'),
    p_value_2 = gt::html('<em>p</em>-value')
  )

or all md:

gt::cols_label(
    f_value = gt::md('F-value'),
    p_value = gt::md('*p*-value'),
    f_value_2 = gt::md('F-value'),
    p_value_2 = gt::md('*p*-value')
  )

... interestingly, mixing up gt::html() and gt::md() results in wonky alignment too :confused:

I believe that solved the problem. I will try to incorporate gt() more into my scripts involving tables. Thank you very much.

1 Like