Hello all,
I'm currently trying to build a shiny app to display several metrics for a sales presentation. I've included multiple navigation pages using the 'bslib' package, on which there are plots, tables, and plain text. My issue is that whenever I run the file, the display area for all of the content I've included usually only takes up about half of the browser window. I've tried using 'fluidpage' and 'page_fillable' but neither of these options have seemed to do the trick. Included below is my ui source and a snippet of what the output looks like visually.
Code:
library(shiny)
library(shinythemes)
library(DT)
library(bslib)
source("\Users\13146\Downloads\OE Documents\Shiny Functions.R")
ui <- page_fillable(
theme = bs_theme(
bg = "#FFFFFF",
fg = "#000000",
primary = "#0F8A39",
base_font = font_google("Source Sans Pro")
),
page_navbar(
title = NULL, # Remove the title
bg = "#0F8A39",
inverse = TRUE,
nav_panel("Project Overview",
fluidRow(column(3, textInput("client_id", "Client Name", "")))
),
nav_panel("About OE",
div(style = "padding: 20px; height = 600vh; overflow-y = auto;",
h1(strong("The Renewable Energy Experts"),
style = "text-align: center; font-size: 50px; color: black;"),
hr(style = "border-color: #0F8A39;"),
p(style = "text-align: justify; font-size: 25px",
"Orbital Energy is a renewable energy engineering, construction, and consulting company. Helping clients build energy generation and storage systems since 2015, our team has combined decades of experience as engineers and consultants within the energy industry, bringing engineering expertise to the commercial, industrial, and utility sectors across the globe, all with the goal of expanding the distribution of affordable and efficient energy systems worldwide."),
p(),
p(style = "text-align: justify; font-size: 25px",
"At Orbital Energy, we believe that the power to transform our world begins with how we produce and consume energy. We offer top-tier renewable energy solutions that can make a real difference in reducing carbon emissions, enhancing energy security, and driving economic growth. We're committed to this industry because we believe that our work has a real impact on the world and we take pride in being the best at what we do."),
p(),
p(style = "text-align: justify; font-size: 25px",
"We understand that choosing the right energy partner is a critical decision and are dedicated to providing quality, best-in-class solutions and focused on bringing value to our clients. Leveraging our depth of experience, we have a team of experts who will work closely with you to understand your energy needs, identify the best solutions, and guide you through the entire process. We invite you to join us on this journey to create a more vibrant and sustainable world!")
)),
nav_panel("Electricity and Cost to do Nothing",
fluidRow(
column(3, numericInput("annual_bill", "Annual Electricity Bill", value = "", min = 0, max = 1000000)),
column(3, numericInput("solar_cost", "Cost of Solar", value = "", min = 0, max = 10000000)),
column(3, numericInput("inf_rate", "Inflation (%)", value = "3.5", min = 0, max = 100))
),
fluidRow(
h3("Cost to do Nothing", style = "text-align: left; color: #11477B; font-size: 12"),
column(6, plotOutput("ctdn_plot")),
column(6, plotOutput("cctdn_plot"))
)
),
nav_panel("Renewable Energy Credits",
fluidRow(
column(3, numericInput("system_size", "System Size (AC kW)", value = "", min = 0, max = 10000000)),
column(3, numericInput("annual_output", "Single Year Output", value = "", min = 0, max = 10000000)),
column(3, textInput("metric", "Measure", value = "kWh", placeholder = "- MWh,kWh,Wh")),
column(3, textInput("utility_provider", "Utility Provider", value = "ComEd", placeholder = "Ameren/ComEd"))
),
mainPanel(
width = 12,
fillPage(
DTOutput("REC_Table"),
height = "100%"
)
)
),
nav_spacer()
)
)
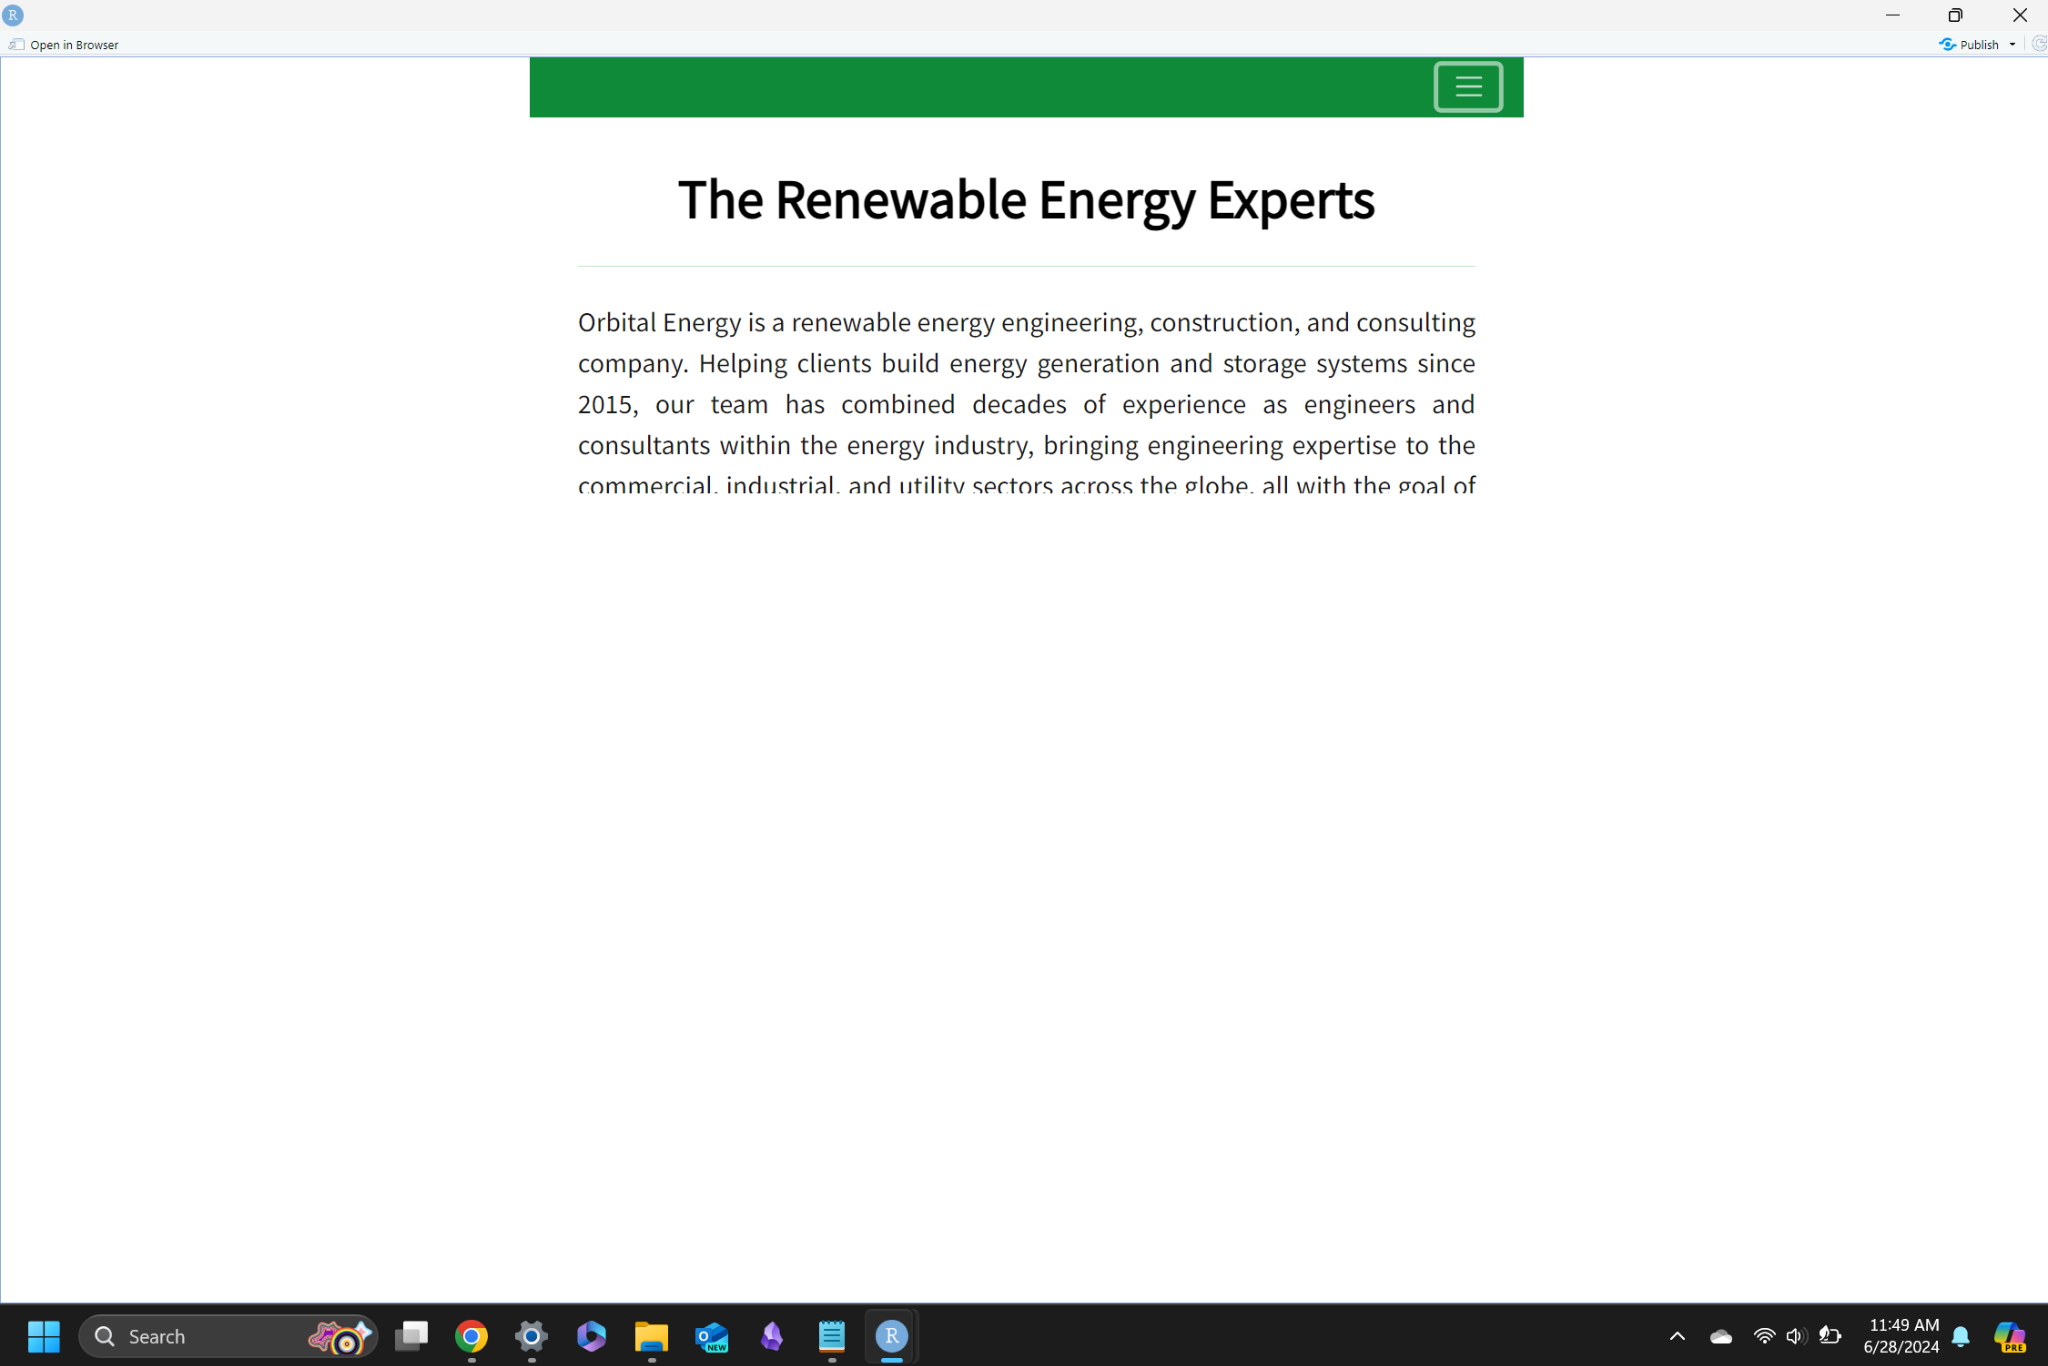
Screenshot of output: