I am using ggplot2 to create a series of plots with a large but variable number of rows (typically between 20 and 200). For readability, I would like to include the SAME legend twice: one copy on top and one copy at the bottom.
I have seen many suggestions using ggplotGrob (Quick ggplot2 Tip: Creating Duplicate Legends ) and cowplot (r - How to duplicate a legend in ggplot and edit content - Stack Overflow ). All these solutions force the placement of the legend. This does not for me since the height of my plots is not constant and a placement that works well for one plot will not work for another plot.
Unless I am mistaken, there is no easy way to do this by default in ggplot2. Is this correct? It would be nice to be able to specify position = c("top", "bottom") or something similar. Any other suggestion would be appreciated.
Fan
June 18, 2024, 12:36pm
2
maybe ggtext? It can be used to print texts if you provide exact (x,y)
Hi @huguesm ,
Could you share both the data and the code you're using, along with a visual example of what you would like to see? That would be helpful for folks here who would like to help you troubleshoot.
You can share the data by running dput(your data table), then copying the output and pasting it here, between a pair of triple backticks, like this:
```
paste here
```
And you can share the code you used to produce your (undesired) plot in the same way — between a pair of triple backticks.
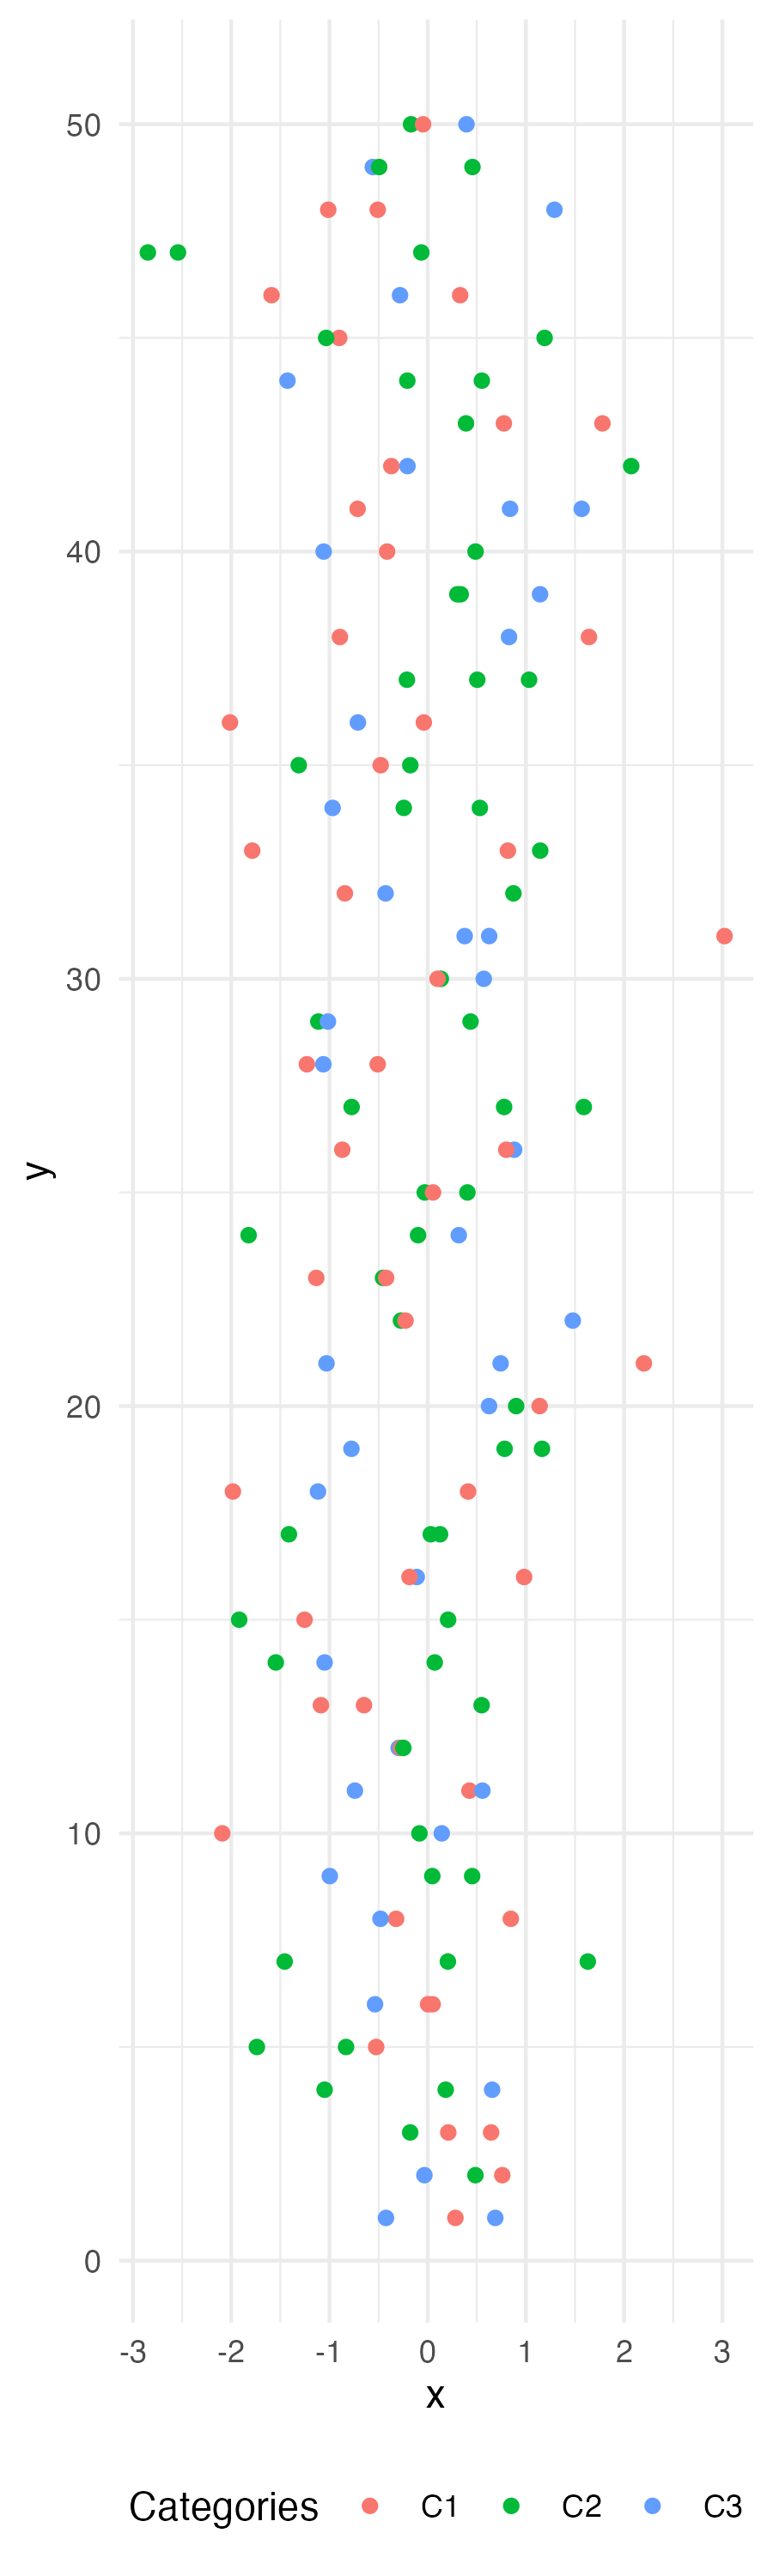
A graph like this, for instance.
library(ggplot2)

data <- data.frame(
  x = rnorm(150),
  y = rep(seq(1,50), length.out = 150),
  category = factor(sample(c("C1", "C2", "C3"), 30, replace = TRUE))
)

plot <- ggplot(data, aes(x = x, y = y, color = category)) +
  geom_point() +
  theme_minimal() +
  theme(legend.position = c("top")) +
  labs(color = "Categories")

print(plot)
I can put a legend and the bottom or at the top, but not both. I want two copies of the legend, at the top and at the bottom.
maybe ggtext? It can be used to print texts if you provide exact (x,y)
The height of the plot varies. I want to automate the placement of the second legend. Relative position is also very tricky to set.
library(ggplot2)
library(cowplot)
data <- data.frame(
  x = rnorm(150),
  y = rep(seq(1,50), length.out = 150),
  category = factor(sample(c("C1", "C2", "C3"), 30, replace = TRUE))
)

plot <- ggplot(data, aes(x = x, y = y, color = category)) +
  geom_point() +
  theme_minimal() +
  theme(legend.direction = "horizontal")+
  labs(color = "Categories")

legend <- cowplot::get_legend(plot)


cowplot::plot_grid(plot + theme(legend.position = "top"),
                   legend,
                   ncol = 1,rel_heights = c(1,.1))
2 Likes
Thanks, @huguesm — here's a sort of hack that is close to what you want:
library(tidyverse)

data <- data.frame(
  x = rnorm(150),
  y = rep(seq(1,50), length.out = 150),
  category = factor(sample(c("C1", "C2", "C3"), 30, replace = TRUE))
) |>
  mutate(category2 = category)

plot <- ggplot(data, aes(x = x, y = y, color = category)) +
  geom_point(aes(fill = category2), shape = 21) +
  geom_point() +
  scale_color_discrete(guide = guide_legend(position = 'top')) +
  scale_fill_discrete(guide = guide_legend(position = 'bottom')) +
  theme_minimal() +
  labs(color = "Categories", fill = " Categories")

print(plot)
Created on 2024-06-18 with reprex v2.0.2
@dromano This is certainly simple, but unfortunately the legends are slightly different.
@nirgrahamuk Thanks. I must adjust rel_heights dynamically depending on the height of the plot, but otherwise it appears to work well.
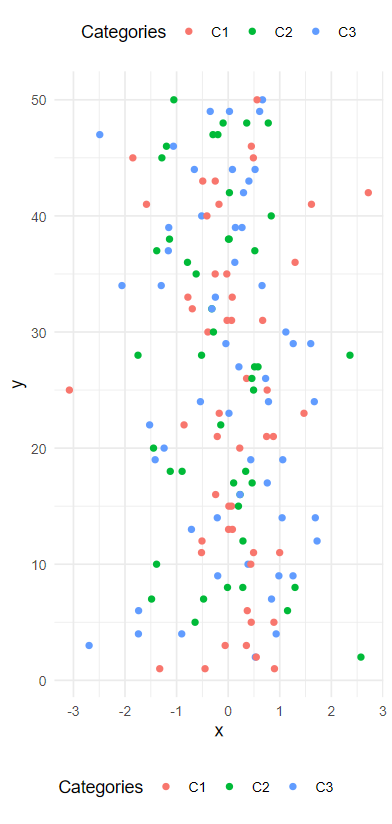
Here the legend icon are the same, but whether the solution generalizes will likely depend on your use case:
library(tidyverse)

data <- data.frame(
  x = rnorm(150),
  y = rep(seq(1,50), length.out = 150),
  category = factor(sample(c("C1", "C2", "C3"), 30, replace = TRUE))
) |>
  mutate(category2 = category)

plot <-
ggplot(data, aes(x = x, y = y, color = category)) +
  geom_point(aes(fill = category2), shape = 21,
    key_glyph =
      \(d, p, s) {d$stroke = 0; d$size = 2; draw_key_point(d, p, s)}
  ) +
  geom_point() +
  scale_color_discrete(guide = guide_legend(position = 'top')) +
  scale_fill_discrete(guide = guide_legend(position = 'bottom'), ) +
  theme_minimal() +
  labs(color = "Categories", fill = " Categories")

print(plot)
Created on 2024-06-20 with reprex v2.0.2
Many thanks. My use case is more complicated, but I will check if I can do something similar. This is quite hackish for something that ggplot2 should allow by default. Many thanks again!
system
June 27, 2024, 8:25am
12
This topic was automatically closed 7 days after the last reply. New replies are no longer allowed.