access all input variables at module server-side without hard-coding input variable names

,

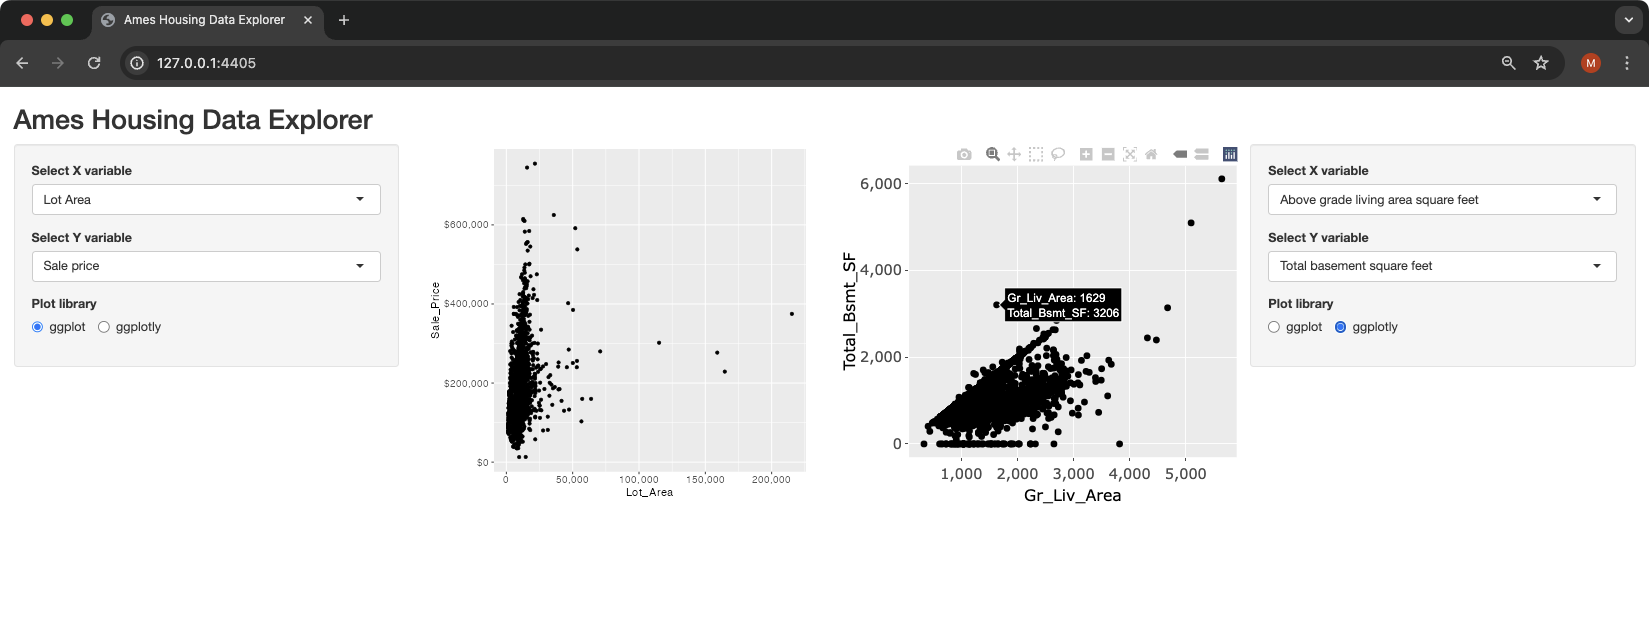
I want to make any modules I make as a portal set of separated parts of input and output, as demonstrated at Shiny - Communication between modules

There in the Motivating Example of Ames Housing Data Exporter, only two input variables xvar and yvar are used, but in general I have much more different set of input variables.

I could decrease the number of hard-coding xvar and yvar, as seen in the reprex I put below, but I cannot figure out how to make varselect_mod_server without hard-coding. How can I do that?

e.g. Is there a way to get the full list of input variable names defined in its corresponding varselect_mod_ui? Then I can do list_ret[[varname]] = reactive({ input[[varname]] }). As they are in reactive({ input$blabla }), accessing simply by names(input) does not work. Thanks in advance.

# varselect_mod_server <- function(input, output, session) {
varselect_mod_server <- function(id) {
  moduleServer(id, function(input, output, session) {
    
    #  print(str(input))
    # l_ret <- list()
    # for (varn in names(input)){
    #   print(varn)
    #   l_ret[[varn]] = reactive({ input[[varn]] })
    # }
    # return(l_ret)
    return(
      list(
        xvar = reactive({ input$xvar })
        ,
        yvar = reactive({ input$yvar })
      )
    )
  })
}

A reprex that I modified from the original code is as follows.

  • Use moduleServer instead of callModule.
  • Make one plot in one output, not two plots side by side in one output.
  • Don't use scatter_sales in helpers.R to decrease hard-coding of input variable names.

app.R

#
# This is a Shiny web application. You can run the application by clicking
# the 'Run App' button above.
#
# Find out more about building applications with Shiny here:
#
#    http://shiny.rstudio.com/
#

library(shiny)

# load packages
library(AmesHousing)
library(dplyr)
library(rlang)
library(ggplot2)
library(scales)

# load separate module and function scripts
# source("modules.R")
# source("helpers.R")

# user interface
ui <- fluidPage(
  
  titlePanel("Ames Housing Data Explorer"),
  
  fluidRow(
    column(
      width = 3,
      wellPanel(
        varselect_mod_ui("plot1_vars")
      )
    ),
    column(
      width = 6,
      # scatterplot_mod_ui("plots")
      tagList(
        fluidRow(
          column(
            width = 6,
            scatterplot_single_mod_ui("plot1")
          ),
          column(
            width = 6,
            scatterplot_single_mod_ui("plot2")
          )
        )
      )
    ),
    column(
      width = 3,
      wellPanel(
        varselect_mod_ui("plot2_vars")
      )
    )
  )
)

# server logic
server <- function(input, output, session) {
  
  # prepare dataset
  ames <- make_ames() # AmesHousing
  
  # execute plot variable selection modules
  plot1vars <- varselect_mod_server("plot1_vars")
  plot2vars <- varselect_mod_server("plot2_vars")
  # plot1vars <- callModule(varselect_mod_server, "plot1_vars")
  # plot2vars <- callModule(varselect_mod_server, "plot2_vars")
  
  # execute scatterplot module
  res1 <- scatterplot_single_mod_server("plot1", 
                                dataset = ames, 
                                plotvars = plot1vars)
  res2 <- scatterplot_single_mod_server("plot2", 
                                dataset = ames, 
                                plotvars = plot2vars)
  # res <- scatterplot_mod_server("plots", 
  #                               dataset = ames, 
  #                               plot1vars = plot1vars, 
  #                               plot2vars = plot2vars)
  # res <- callModule(scatterplot_mod_server,
  #                   "plots",
  #                   dataset = ames,
  #                   plot1vars = plot1vars,
  #                   plot2vars = plot2vars)
  
}

# Run the application 
shinyApp(ui = ui, server = server)

modules.R

  • Not changed are:
    • varselect_mod_ui
    • varselect_mod_server
  • Modified are:
    • scatterplot_single_mod_ui
    • scatterplot_single_mod_server
    • Output one plot, instead of outputting two plots together in the original scatterplot_mod_ui and scatterplot_single_mod_server.
#' Variable selection for plot user interface
#'
#' @param id, character used to specify namespace, see \code{shiny::\link[shiny]{NS}}
#'
#' @return a \code{shiny::\link[shiny]{tagList}} containing UI elements
varselect_mod_ui <- function(id) {
  ns <- NS(id)
  
  # define choices for X and Y variable selection
  var_choices <- list(
    `Sale price` = "Sale_Price",
    `Total basement square feet` = "Total_Bsmt_SF",
    `First floor square feet` = "First_Flr_SF",
    `Lot Frontage` = "Lot_Frontage",
    `Lot Area` = "Lot_Area",
    `Masonry vaneer area` = "Mas_Vnr_Area",
    `1st floor square feet` = "First_Flr_SF",
    `2nd floor square feet` = "Second_Flr_SF",
    `Low quality finished square feet` = "Low_Qual_Fin_SF",
    `Above grade living area square feet` = "Gr_Liv_Area",
    `Garage area square feet` = "Garage_Area"
  )
  
  # assemble UI elements
  tagList(
    selectInput(
      ns("xvar"),
      "Select X variable",
      choices = var_choices,
      selected = "Lot_Area"
    )
    ,
    selectInput(
      ns("yvar"),
      "Select Y variable",
      choices = var_choices,
      selected = "Sale_Price"
    )
  )
}

#' Variable selection module server-side processing
#'
#' @param input,output,session standard \code{shiny} boilerplate
#'
#' @return list with following components
#' \describe{
#'   \item{xvar}{reactive character indicating x variable selection}
#'   \item{yvar}{reactive character indicating y variable selection}
#' }

# varselect_mod_server <- function(input, output, session) {
varselect_mod_server <- function(id) {
  moduleServer(id, function(input, output, session) {
    
    #  print(str(input))
    # l_ret <- list()
    # for (varn in names(input)){
    #   print(varn)
    #   l_ret[[varn]] = reactive({ input[[varn]] })
    # }
    # return(l_ret)
    return(
      list(
        xvar = reactive({ input$xvar })
        ,
        yvar = reactive({ input$yvar })
      )
    )
  })
}


#' Scatterplot module user interface
#'
#' @param id, character used to specify namespace, see \code{shiny::\link[shiny]{NS}}
#'
#' @return a \code{shiny::\link[shiny]{tagList}} containing UI elements
#' @export
#'
#' @examples
scatterplot_single_mod_ui <- function(id) {
  ns <- NS(id)
  
  plotOutput(ns("plotn"))

  # tagList(
  #   fluidRow(
  #     column(
  #       width = 6,
  #       plotOutput(ns("plot1"))
  #     ),
  #     column(
  #       width = 6,
  #       plotOutput(ns("plot2"))
  #     )
  #   )
  # )
}

#' Scatterplot module server-side processing
#'
#' This module produces a scatterplot with the sales price against a variable selected by the user.
#' 
#' @param input,output,session standard \code{shiny} boilerplate
#' @param dataset data frame (non-reactive) with variables necessary for scatterplot
#' @param plotvars list containing reactive x-variable name (called `xvar`) and y-variable name (called `yvar`) for plot
scatterplot_single_mod_server <- function(id, 
                                          dataset, 
                                          plotvars) {
  moduleServer(id, function(input, output, session) {
    
    plotn_obj <- reactive({
      # str(plotvars)
      # print(plotvars[['xvar']])
      # print(names(plotvars))
      
      var_entities <- list()
      var_symbols <- list()
      for (varn in names(plotvars)){
        var_entities[[varn]] <- plotvars[[varn]]()
      }
      
      xvar <- var_entities[['xvar']]
      yvar <- var_entities[['yvar']]
      
      # for (varn in c('xvar', 'yvar')){ #when only small subset of input need to be symbolized. 
      for (varn in names(plotvars)){ #do symbolized for all input vars. 
        var_symbols[[varn]] <- rlang::sym(var_entities[[varn]])
      }
      x <- var_symbols[['xvar']]
      y <- var_symbols[['yvar']]
      
      # xvar <- plotvars$xvar()
      # yvar <- plotvars$yvar()
      
      # x <- rlang::sym(xvar)
      # y <- rlang::sym(yvar)
      
      p <- ggplot(dataset, aes(x = !!x, y = !!y)) + # ok, as orig
        geom_point() +
        scale_x_continuous(labels = function(l) plot_labeller(l, varname = xvar)) +
        scale_y_continuous(labels = function(l) plot_labeller(l, varname = yvar)) +
        theme(axis.title = element_text(size = rel(1.2)),
              axis.text = element_text(size = rel(1.1)))
      
      # x <- rlang::sym(plotvars$xvar())
      # y <- rlang::sym(plotvars$yvar())
      # 
      # p <- ggplot(dataset, aes(x = !!x, y = !!y)) + # ok, as orig
      #   geom_point() +
      #   scale_x_continuous(labels = function(l) plot_labeller(l, varname = plotvars$xvar())) +
      #   scale_y_continuous(labels = function(l) plot_labeller(l, varname = plotvars$yvar())) +
      #   theme(axis.title = element_text(size = rel(1.2)),
      #         axis.text = element_text(size = rel(1.1)))
        
      # p <- scatter_sales(dataset, xvar = plotvars$xvar(), yvar = plotvars$yvar())
      return(p)
    })
    
    # plot2_obj <- reactive({
    #   p <- scatter_sales(dataset, xvar = plot2vars$xvar(), yvar = plot2vars$yvar())
    #   return(p)
    # })
    
    output$plotn <- renderPlot({
      plotn_obj()
    })
    
    # output$plot2 <- renderPlot({
    #   plot2_obj()
    # })
  })
}

helpers.R

  • Omit scatter_sales. Instead corresponding codes are written in scatterplot_single_mod_server.
plot_labeller <- function(l, varname) {
  if (varname == "Sale_Price") {
    res <- dollar(l)
  } else {
    res <- comma(l)
  }
  return(res)
}

I found that the solution is to use lapply, thanks to the answer by Joy to this old post: R Shiny assign reactive values to a pasted object - Stack Overflow.

Second, names(isolate(reactiveValuesToList(input))) is the code to access all input variables at module server-side without hard-coding input variable names .

By combining these two tips, following is the way to avoid hard-coding of input variable names in varselect_mod_server. By this way, the input variable names hard-coded can be the same as standard way of writing ui and server.

# varselect_mod_server <- function(input, output, session) {
varselect_mod_server <- function(id) {
  moduleServer(id, function(input, output, session) {
    
    l_ret <- reactiveValues(
    )
    
    my_input_varnames <- names(isolate(reactiveValuesToList(input)))
    
    # print(my_input_varnames) # [1] "xvar" "yvar"
    
    n_max <- length(my_input_varnames)
    lapply(1:n_max, function(i){
      l_ret[[my_input_varnames[i]]] <- reactive({
        input[[my_input_varnames[i]]]
      })
    })
    
    return(l_ret)
    
    # ok
    # l_ret_orig <- list(
    #   xvar = reactive({ input$xvar })
    #   ,
    #   yvar = reactive({ input$yvar })
    # )
    # print(l_ret_orig)
    # return(l_ret_orig)
    
    # ok, as orig
    # return(
    #   list(
    #     xvar = reactive({ input$xvar })
    #     ,
    #     yvar = reactive({ input$yvar })
    #   )
    # )
  })
}

This lapply approach solves a related issue found here: R Shiny: how to generate reactive expression on the fly - Stack Overflow

Note added.

To use UI-side functionality of conditionalPanel with raw javascript code with the above approach, it is necessary to pass second name space id to scatterplot_single_mod_ui. This works, although I'm not sure this is an approved approach or something against the recommendation of conditionalpanel: '(Be sure not to modify the input/output objects, as this may cause unpredictable behavior.)'.

  1. In main UI, pass the second name space, which refers to varselect_mod_ui, to scatterplot_single_mod_ui .
    e.g.
    change
    scatterplot_single_mod_ui("plot1")
    to
    scatterplot_single_mod_ui("plot1", "plot1_vars").
  2. In scatterplot_single_mod_ui,
    1. take a second argument of name space.

      scatterplot_single_mod_ui <- function(id, id2) {
        ns <- NS(id)
        ns2 <- NS(id2)
      
    2. pass the second name space to conditionalPanel.

      conditionalPanel(..., ns = ns2)
      
    3. change the javascript label the same as that set in scatterplot_single_mod_server.

      conditionalPanel(condition = 'var_entities.type_plot_library == "ggplotly"', ...)
      

Note. mapping name space in scatterplot_single_mod_server to input but not to var_entities makes changes to be made as less as possible, as shown below.

Below, radio button is added to the above Ames Housing Data Exporter example to enable selection of the type of plot library (ggplot or ggplotly).

app.R

  • library(plotly) is added.
  • second name space id is passed to scatterplot_single_mod_ui (two places).
library(shiny)

# load packages
# library(shiny)
library(AmesHousing)
library(dplyr)
library(rlang)
library(ggplot2)
library(scales)
library(plotly)

# load separate module and function scripts
# source("modules.R")
# source("helpers.R")

# user interface
ui <- fluidPage(
  
  titlePanel("Ames Housing Data Explorer"),
  
  fluidRow(
    column(
      width = 3,
      wellPanel(
        varselect_mod_ui("plot1_vars")
      )
    ),
    column(
      width = 6,
      # scatterplot_mod_ui("plots")
      tagList(
        fluidRow(
          column(
            width = 6,
            scatterplot_single_mod_ui("plot1", "plot1_vars")
          ),
          column(
            width = 6,
            scatterplot_single_mod_ui("plot2", "plot2_vars")
          )
        )
      )
    ),
    column(
      width = 3,
      wellPanel(
        varselect_mod_ui("plot2_vars")
      )
    )
  )
)

# server logic
server <- function(input, output, session) {
  
  # prepare dataset
  ames <- make_ames() # AmesHousing
  
  # execute plot variable selection modules
  plot1vars <- varselect_mod_server("plot1_vars")
  plot2vars <- varselect_mod_server("plot2_vars")
  
  # execute scatterplot module
  # res1 <- 
    scatterplot_single_mod_server("plot1", 
                                dataset = ames, 
                                plotvars = plot1vars)
  # res2 <- 
    scatterplot_single_mod_server("plot2", 
                                dataset = ames, 
                                plotvars = plot2vars)
  
}

# Run the application 
shinyApp(ui = ui, server = server)

modules.R

  • In varselect_mod_ui, radioButtons is added.
  • In scatterplot_single_mod_ui, pass second name space id id2.
  • In scatterplot_single_mod_ui, pass ns2 to conditionalPanel.
#' Variable selection for plot user interface
#'
#' @param id, character used to specify namespace, see \code{shiny::\link[shiny]{NS}}
#'
#' @return a \code{shiny::\link[shiny]{tagList}} containing UI elements
varselect_mod_ui <- function(id) {
  ns <- NS(id)
  
  # define choices for X and Y variable selection
  var_choices <- list(
    `Sale price` = "Sale_Price",
    `Total basement square feet` = "Total_Bsmt_SF",
    `First floor square feet` = "First_Flr_SF",
    `Lot Frontage` = "Lot_Frontage",
    `Lot Area` = "Lot_Area",
    `Masonry vaneer area` = "Mas_Vnr_Area",
    `1st floor square feet` = "First_Flr_SF",
    `2nd floor square feet` = "Second_Flr_SF",
    `Low quality finished square feet` = "Low_Qual_Fin_SF",
    `Above grade living area square feet` = "Gr_Liv_Area",
    `Garage area square feet` = "Garage_Area"
  )
  
  # assemble UI elements
  tagList(
    selectInput(
      ns("xvar"),
      "Select X variable",
      choices = var_choices,
      selected = "Lot_Area"
    )
    ,
    selectInput(
      ns("yvar"),
      "Select Y variable",
      choices = var_choices,
      selected = "Sale_Price"
    )
    ,
    radioButtons(
      ns("type_plot_library"), 
      "Plot library", 
      c('ggplot', 'ggplotly'), 
      selected = 'ggplot', 
      inline = TRUE
    )
  )
}

#' Variable selection module server-side processing
#'
#' @param input,output,session standard \code{shiny} boilerplate
#'
#' @return list with following components
#' \describe{
#'   \item{xvar}{reactive character indicating x variable selection}
#'   \item{yvar}{reactive character indicating y variable selection}
#' }

varselect_mod_server <- function(id) {
  moduleServer(id, function(input, output, session) {
    
    l_ret <- reactiveValues(
    )
    
    my_input_varnames <- names(isolate(reactiveValuesToList(input)))
    
    # print(my_input_varnames) # [1] "xvar" "yvar"
    
    n_max <- length(my_input_varnames)
    lapply(1:n_max, function(i){
      l_ret[[my_input_varnames[i]]] <- reactive({
        input[[my_input_varnames[i]]]
      })
    })
    
    return(l_ret)
    
    # ok
    # l_ret_orig <- list(
    #   xvar = reactive({ input$xvar })
    #   ,
    #   yvar = reactive({ input$yvar })
    # )
    # print(l_ret_orig)
    # return(l_ret_orig)
    
    # ok, as orig
    # return(
    #   list(
    #     xvar = reactive({ input$xvar })
    #     ,
    #     yvar = reactive({ input$yvar })
    #   )
    # )
  })
}

#' Scatterplot module user interface
#'
#' @param id, character used to specify namespace, see \code{shiny::\link[shiny]{NS}}
#'
#' @return a \code{shiny::\link[shiny]{tagList}} containing UI elements
#' @export
#'
#' @examples
scatterplot_single_mod_ui <- function(id, id2) {
  ns <- NS(id)
  ns2 <- NS(id2)
  
  tagList(
    conditionalPanel(
      condition = 'input.type_plot_library == "ggplotly"', ns = ns2,
      plotlyOutput(ns("plotn_ggplotly"))
    )
    ,
    conditionalPanel(
      condition = 'input.type_plot_library == "ggplot"', ns = ns2,
      plotOutput(
        ns("plotn_ggplot"),
        click = ns("plot_click"),
        dblclick = ns("plot_dblclick"),
        hover = ns("plot_hover"),
        brush = ns("plot_brush"),
        width = "100%"
      )
    )
  )
}

#' Scatterplot module server-side processing
#'
#' This module produces a scatterplot with the sales price against a variable selected by the user.
#' 
#' @param input,output,session standard \code{shiny} boilerplate
#' @param dataset data frame (non-reactive) with variables necessary for scatterplot
#' @param plotvars list containing reactive x-variable name (called `xvar`) and y-variable name (called `yvar`) for plot
scatterplot_single_mod_server <- function(id, 
                                          dataset, 
                                          plotvars) {
  moduleServer(id, function(input, output, session) {
    
    plotn_obj <- reactive({
      
      input <- list()
      for (varn in names(plotvars)){
        input[[varn]] <- plotvars[[varn]]()
      }

      xvar <- input[['xvar']]
      yvar <- input[['yvar']]
      
      var_symbols <- list()
      # for (varn in c('xvar', 'yvar')){ #when only small subset of input need to be symbolized. 
      for (varn in names(plotvars)){ #do symbolized for all input vars. 
        var_symbols[[varn]] <- rlang::sym(input[[varn]])
      }
      
      # var_entities <- list()
      # for (varn in names(plotvars)){
      #   var_entities[[varn]] <- plotvars[[varn]]()
      # }
      # 
      # xvar <- var_entities[['xvar']]
      # yvar <- var_entities[['yvar']]
      # 
      # var_symbols <- list()
      # # for (varn in c('xvar', 'yvar')){ #when only small subset of input need to be symbolized. 
      # for (varn in names(plotvars)){ #do symbolized for all input vars. 
      #   var_symbols[[varn]] <- rlang::sym(var_entities[[varn]])
      # }
      
      x <- var_symbols[['xvar']]
      y <- var_symbols[['yvar']]
      
      # xvar <- plotvars$xvar()
      # yvar <- plotvars$yvar()
      
      # x <- rlang::sym(xvar)
      # y <- rlang::sym(yvar)
      
      p <- ggplot(dataset, aes(x = !!x, y = !!y)) + # ok, as orig
        geom_point() +
        scale_x_continuous(labels = function(l) plot_labeller(l, varname = xvar)) +
        scale_y_continuous(labels = function(l) plot_labeller(l, varname = yvar)) +
        theme(axis.title = element_text(size = rel(1.2)),
              axis.text = element_text(size = rel(1.1)))
      
      # x <- rlang::sym(plotvars$xvar())
      # y <- rlang::sym(plotvars$yvar())
      # 
      # p <- ggplot(dataset, aes(x = !!x, y = !!y)) + # ok, as orig
      #   geom_point() +
      #   scale_x_continuous(labels = function(l) plot_labeller(l, varname = plotvars$xvar())) +
      #   scale_y_continuous(labels = function(l) plot_labeller(l, varname = plotvars$yvar())) +
      #   theme(axis.title = element_text(size = rel(1.2)),
      #         axis.text = element_text(size = rel(1.1)))
        
      # p <- scatter_sales(dataset, xvar = plotvars$xvar(), yvar = plotvars$yvar())
      return(p)
    })
    
    output$plotn_ggplot <- renderPlot({
      plotn_obj()
    })
    
    output$plotn_ggplotly <- renderPlotly({
      # g
      g <- plotn_obj()
      
      # ggplotly(g, height = 800, width = 900)
      ggplotly(g, height = 400, width = 450)
    })
    
  })
}

helpers.R

  • no change.
plot_labeller <- function(l, varname) {
  if (varname == "Sale_Price") {
    res <- dollar(l)
  } else {
    res <- comma(l)
  }
  return(res)
}

Note to make it unnecessary to access all input variables.

My intention was to make any modules I make to make a view of input-of-left, output-of-left, output-of-right, input-of-right as in the Motivating Example of Ames Housing Data Exporter.

Regarding this purpose, I found standard approach is far simpler and just enough, without bothering to access namespace of another module, as shown in the following reprex.

The point is that we can make a module that has multiple different uis, as far as namespace id is correctly assigned to (i.e. not necessarily <mymodule>_ui / <mymodule>_server). In the following reprex, I made an internal module which consists of two uis, scatterplot_single_varselect_ui and scatterplot_single_output, which is paired with one server, scatterplot_single_server.

app.R

# load packages
library(shiny)
library(AmesHousing)
library(dplyr)
library(rlang)
library(ggplot2)
library(scales)
library(plotly)

# load separate module and function scripts
# source("modules.R")
# source("helpers.R")

# user interface
ui <- fluidPage(
  scatterplot_side_by_side_ui("plot_side_by_side")
)

# server logic
server <- function(input, output, session) {
  
  scatterplot_side_by_side_server("plot_side_by_side")
  
}

# Run the application 
shinyApp(ui = ui, server = server)

modules.R

In the outside module scatterplot_side_by_side_ui / scatterplot_side_by_side_server, the name space ids plot1 and plot2 are used twice in ui (once for two internal uis) and once in server (for the internal server), respectively.

#' Variable selection for plot user interface
#'
#' @param id, character used to specify namespace, see \code{shiny::\link[shiny]{NS}}
#'
#' @return a \code{shiny::\link[shiny]{tagList}} containing UI elements
scatterplot_single_varselect_ui <- function(id) {
  ns <- NS(id)
  
  # define choices for X and Y variable selection
  var_choices <- list(
    `Sale price` = "Sale_Price",
    `Total basement square feet` = "Total_Bsmt_SF",
    `First floor square feet` = "First_Flr_SF",
    `Lot Frontage` = "Lot_Frontage",
    `Lot Area` = "Lot_Area",
    `Masonry vaneer area` = "Mas_Vnr_Area",
    `1st floor square feet` = "First_Flr_SF",
    `2nd floor square feet` = "Second_Flr_SF",
    `Low quality finished square feet` = "Low_Qual_Fin_SF",
    `Above grade living area square feet` = "Gr_Liv_Area",
    `Garage area square feet` = "Garage_Area"
  )
  
  # assemble UI elements
  tagList(
    selectInput(
      ns("xvar"),
      "Select X variable",
      choices = var_choices,
      selected = "Lot_Area"
    )
    ,
    selectInput(
      ns("yvar"),
      "Select Y variable",
      choices = var_choices,
      selected = "Sale_Price"
    )
    ,
    radioButtons(
      ns("type_plot_library"), 
      "Plot library", 
      c('ggplot', 'ggplotly'), 
      selected = 'ggplot', 
      inline = TRUE
    )
  )
}

#' Scatterplot module user interface
#'
#' @param id, character used to specify namespace, see \code{shiny::\link[shiny]{NS}}
#'
#' @return a \code{shiny::\link[shiny]{tagList}} containing UI elements
#' @export
#'
#' @examples
scatterplot_single_output <- function(id) {
  ns <- NS(id)
  
  tagList(
    conditionalPanel(
      condition = 'input.type_plot_library == "ggplotly"', ns = ns,
      plotlyOutput(ns("plotn_ggplotly"))
    )
    ,
    conditionalPanel(
      condition = 'input.type_plot_library == "ggplot"', ns = ns,
      plotOutput(
        ns("plotn_ggplot"),
        click = ns("plot_click"),
        dblclick = ns("plot_dblclick"),
        hover = ns("plot_hover"),
        brush = ns("plot_brush"),
        width = "100%"
      )
    )
  )
}


#' Scatterplot module server-side processing
#'
#' This module produces a scatterplot with the sales price against a variable selected by the user.
#' 
#' @param input,output,session standard \code{shiny} boilerplate
#' @param dataset data frame (non-reactive) with variables necessary for scatterplot
scatterplot_single_server <- function(id, 
                                          dataset) {
  moduleServer(id, function(input, output, session) {
    
    plotn_obj <- reactive({

      xvar <- input$xvar
      yvar <- input$yvar

      # xvar <- plotvars$xvar()
      # yvar <- plotvars$yvar()
      
      x <- rlang::sym(xvar)
      y <- rlang::sym(yvar)
      
      p <- ggplot(dataset, aes(x = !!x, y = !!y)) + # ok, as orig
        geom_point() +
        scale_x_continuous(labels = function(l) plot_labeller(l, varname = xvar)) +
        scale_y_continuous(labels = function(l) plot_labeller(l, varname = yvar)) +
        theme(axis.title = element_text(size = rel(1.2)),
              axis.text = element_text(size = rel(1.1)))
      
      # x <- rlang::sym(plotvars$xvar())
      # y <- rlang::sym(plotvars$yvar())
      # 
      # p <- ggplot(dataset, aes(x = !!x, y = !!y)) + # ok, as orig
      #   geom_point() +
      #   scale_x_continuous(labels = function(l) plot_labeller(l, varname = plotvars$xvar())) +
      #   scale_y_continuous(labels = function(l) plot_labeller(l, varname = plotvars$yvar())) +
      #   theme(axis.title = element_text(size = rel(1.2)),
      #         axis.text = element_text(size = rel(1.1)))
        
      # p <- scatter_sales(dataset, xvar = plotvars$xvar(), yvar = plotvars$yvar())
      return(p)
    })
    
    output$plotn_ggplot <- renderPlot({
      plotn_obj()
    })
    
    output$plotn_ggplotly <- renderPlotly({
      # g
      g <- plotn_obj()
      
      # ggplotly(g, height = 800, width = 900)
      ggplotly(g, height = 400, width = 450)
    })
    
  })
}

#' Scatterplot side by side module user interface
#'
#' @param id, character used to specify namespace, see \code{shiny::\link[shiny]{NS}}
#'
#' @return a \code{shiny::\link[shiny]{tagList}} containing UI elements
scatterplot_side_by_side_ui <- function(id) {
  ns <- NS(id)

  tagList(
    
    titlePanel("Ames Housing Data Explorer"),
    
    fluidRow(
      column(
        width = 3,
        wellPanel(
          scatterplot_single_varselect_ui(ns("plot1"))
        )
      ),
      column(
        width = 6,
        # scatterplot_mod_ui("plots")
        tagList(
          fluidRow(
            column(
              width = 6,
              scatterplot_single_output(ns("plot1"))
            ),
            column(
              width = 6,
              scatterplot_single_output(ns("plot2"))
            )
          )
        )
      ),
      column(
        width = 3,
        wellPanel(
          scatterplot_single_varselect_ui(ns("plot2"))
        )
      )
    )
  )
}


#' Scatterplot side by side module server-side processing
#'
#' This module produces two scatterplots side by side with the sales price against a variable selected by the user.
#' 
#' @param input,output,session standard \code{shiny} boilerplate
scatterplot_side_by_side_server <- function(id) {
  
  moduleServer(id, function(input, output, session) {
    # prepare dataset
    ames <- make_ames() # AmesHousing
    
    # execute scatterplot module
    # res1 <- 
    scatterplot_single_server("plot1", 
                              dataset = ames)
    # res2 <- 
    scatterplot_single_server("plot2", 
                              dataset = ames)
  
  
  })
}

helpers.R

Same as before.

plot_labeller <- function(l, varname) {
  if (varname == "Sale_Price") {
    res <- dollar(l)
  } else {
    res <- comma(l)
  }
  return(res)
}