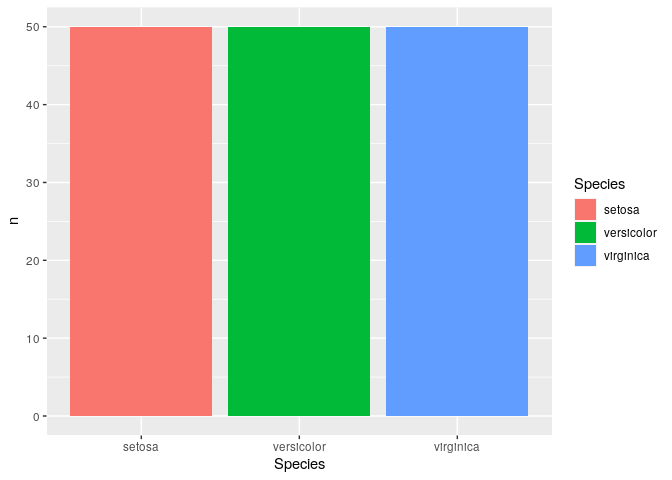
You can't make a histogram for a categorical variable (or "factor" in R terminology), maybe what you really want to make is a column plot of the counts?
library(tidyverse)

iris %>%
    count(Species) %>%
    ggplot(aes(x = Species, y = n, fill = Species)) +
    geom_col()
Created on 2021-01-14 by the reprex package (v0.3.0.9001)
If this is not what you need, please provide a proper REPRoducible EXample (reprex) illustrating your issue.