If you are doing much spatial work in R, I strongly recommend you use the sf package for storing and manipulating spatial objects.
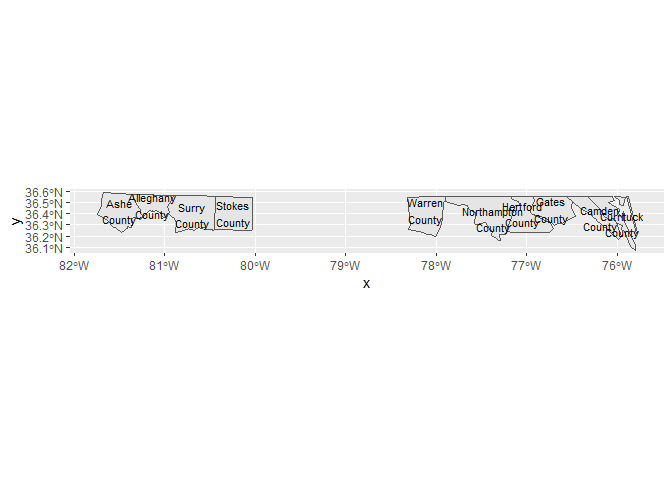
Here, I use the built in NC data set to show how to plot a sf polygons and add text to each polygon using ggplot2::geom_sf_text(). Within that function, I use stringr::str_wrap() in order to force each word in the label to it's own line. Bu default, this will plot the text on the centroid, so you don't need to worry about where to place it.
library(tidyverse)
library(sf)
#> Linking to GEOS 3.8.0, GDAL 3.0.4, PROJ 6.3.1

nc <- st_read(system.file("shape/nc.shp", package = "sf")) %>%
  mutate(NAME = paste(NAME, "County")) %>%
  head(10)
#> Reading layer `nc' from data source `C:\R\win-library\4.0\sf\shape\nc.shp' using driver `ESRI Shapefile'
#> Simple feature collection with 100 features and 14 fields
#> geometry type:  MULTIPOLYGON
#> dimension:      XY
#> bbox:           xmin: -84.32385 ymin: 33.88199 xmax: -75.45698 ymax: 36.58965
#> geographic CRS: NAD27

nc %>%
  ggplot() +
  geom_sf() +
  geom_sf_text(aes(label = str_wrap(NAME, 1)), size = 3)
#> Warning in st_point_on_surface.sfc(sf::st_zm(x)): st_point_on_surface may not
#> give correct results for longitude/latitude data
Created on 2020-07-24 by the reprex package (v0.3.0)