I found help over in Stack Overflow. I had to "reshape" the data and map a group.
library(tidyverse)
library("lubridate")
#>
#> Attaching package: 'lubridate'
#> The following objects are masked from 'package:base':
#>
#> date, intersect, setdiff, union
library(plotly)
#>
#> Attaching package: 'plotly'
#> The following object is masked from 'package:ggplot2':
#>
#> last_plot
#> The following object is masked from 'package:stats':
#>
#> filter
#> The following object is masked from 'package:graphics':
#>
#> layout
library("RColorBrewer")
library(htmlwidgets)
library("reprex")
activity <- c("N", "FB", "N", "N", "N", "FA", "N", "FA", "N", "FA", "N", "N", "N", "N", "N", "FA", "N", "N", "N", "N", "FA", "N", "N", "FA", "FA")
activity_date <- as.Date(c(NA, "2022-04-19", "2022-05-01", "2022-05-01", "2022-05-06", "2022-05-06", "2022-05-07", "2022-05-07", "2022-05-09", "2022-05-09", "2022-05-10", "2022-05-13", "2022-05-14", "2022-05-14", "2022-05-14", "2022-05-15", "2022-05-15", "2022-05-15", "2022-05-15", "2022-05-15", "2022-05-16", "2022-05-16", "2022-05-16", "2022-05-16", "2022-05-16"))
fcrawl_cum <- c(0L, 1L, 1L, 1L, 1L, 2L, 2L, 3L, 3L, 4L, 4L, 4L, 4L, 4L, 4L, 5L, 5L, 5L, 5L, 5L, 6L, 6L, 6L, 7L, 8L)
clutch_cum <- c(1L, 1L, 2L, 3L, 4L, 4L, 5L, 5L, 6L, 6L, 7L, 8L, 9L, 10L, 11L, 11L, 12L, 13L, 14L, 15L, 15L, 16L, 17L, 17L, 17L)
turtle_activity_gtm <- tibble(activity, activity_date, fcrawl_cum, clutch_cum)
the_pal <- RColorBrewer::brewer.pal(n = 8,"Dark2") #Set color palette.
turtle_activity_gtm_long <- turtle_activity_gtm %>%
tidyr::pivot_longer(c(fcrawl_cum, clutch_cum))
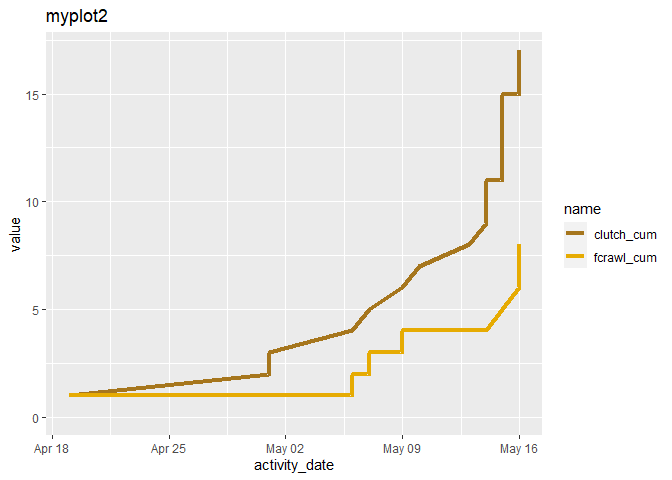
ggplot() +
geom_line(
data = turtle_activity_gtm_long,
aes(
x = activity_date, y = value,
color = name, group = name,
text = paste(
"Date: ", as.Date(activity_date),
"<br>Total: ", value
)
),
na.rm = TRUE,
linewidth = 1.5
) +
scale_color_manual(values = c(clutch_cum = the_pal[[7]], fcrawl_cum = the_pal[[6]])) +
labs(title = "myplot2")
#> Warning in geom_line(data = turtle_activity_gtm_long, aes(x = activity_date, :
#> Ignoring unknown aesthetics: text
Created on 2023-02-08 with reprex v2.0.2
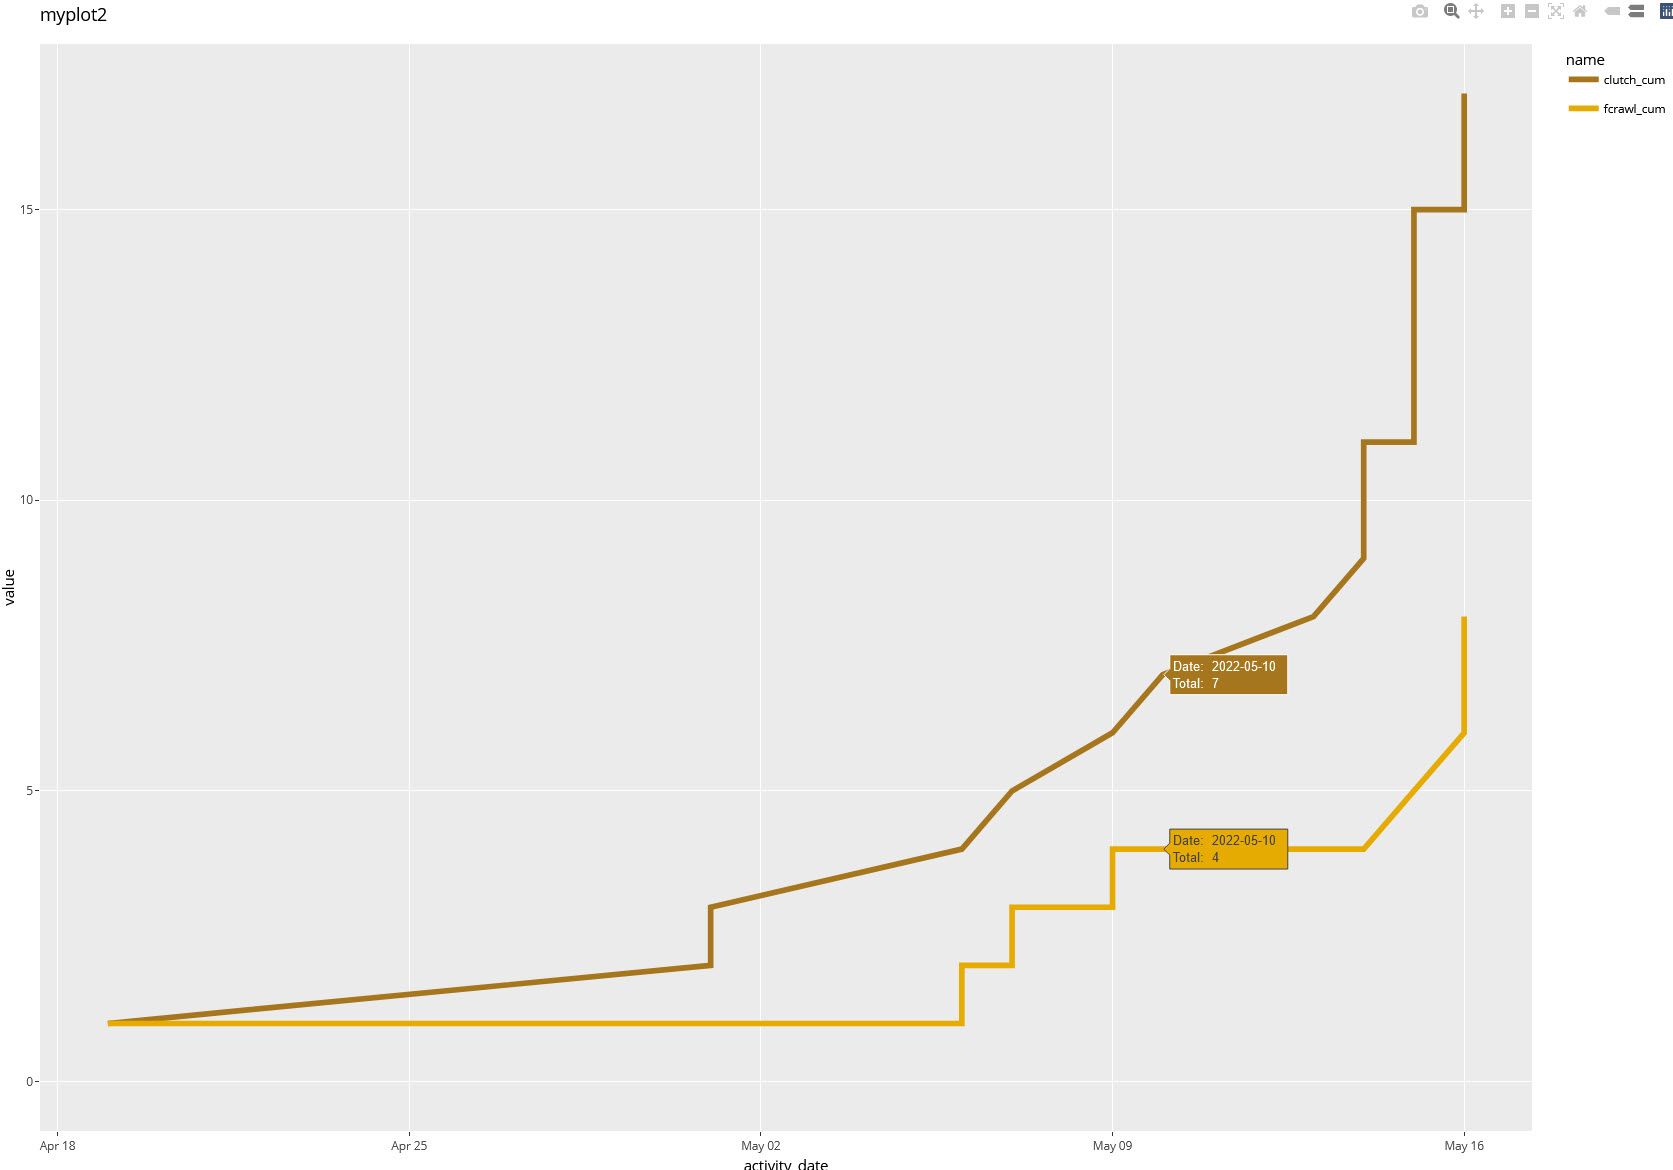
After ggplotly(tooltip = c("text")) , the following screen capture was made.