I have two solutions.
1 Manually rewriting
First method is to use scale_x_discrete() and to reannotate every label:
library(tidyverse)
df <- tibble(concentration = rep(c("Atropine 10^{-3}", "Atropine 10^{-4}"),each=5),
heart = c(rnorm(5, 150, 50), rnorm(5,100,75)))
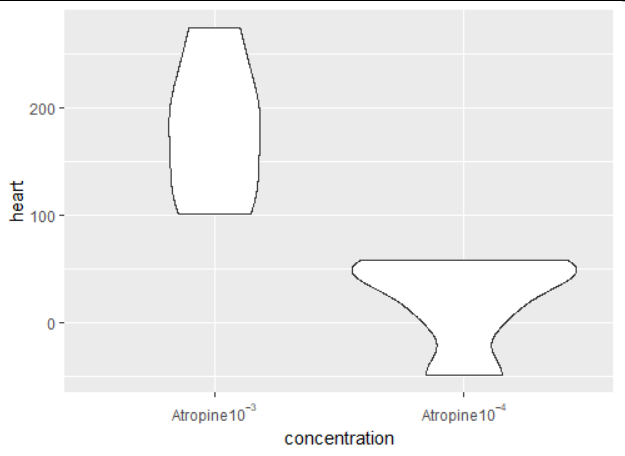
ggplot(df) +
geom_violin(aes(x=concentration, y=heart)) +
scale_x_discrete(labels = c(bquote(Atropine*10^{-3}), bquote(Atropine*10^{-4})))
2 string to expression
The second method is to use str2expression() to convert the strings to expressions. For this to work, you first need to process the strings so that they become plotmath-compatible expressions. In my example, I need to replace the spaces with * or ~. Here is the full description.
So now we can do:
df$concentration2 <- str_replace_all(df$concentration, " ", "*")
ggplot(df) +
  geom_violin(aes(x=concentration, y=heart)) +
  scale_x_discrete(labels = str2expression(df$concentration2))
This almost works, but you will see there is a problem: since concentration contains the full column, here it's 10 values, it's not necessarily ordered as the labels we need. I'm just using unique() for my example, but you might need to reorder to make sure the values are in the right order. The difficulty is that once you've applied str2expression() you can't manipulate that vector anymore, so you need to create a correct vector of labels first.
ggplot(df) +
  geom_violin(aes(x=concentration, y=heart)) +
  scale_x_discrete(labels = str2expression(unique(df$concentration2)))