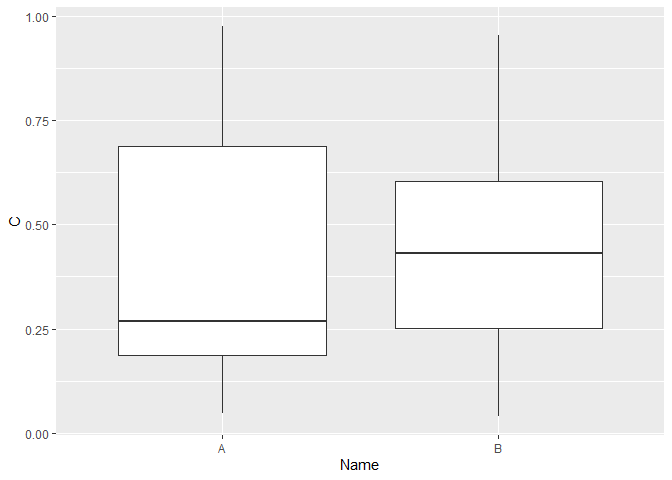
Here is an example where the data frame has 50 rows. The boxplots use the data from the third column. The first column, called Name, has the value A in the first 20 rows and the value B in rows 21 - 50. ggplot makes separate box plots for each Name.
library(ggplot2)
#invent some data
DF <- data.frame(Name = c(rep("A", 20), rep("B", 30)), B = rnorm(50), C = runif(50))
ggplot(DF, aes(x = Name, y = C)) + geom_boxplot()
Created on 2020-08-20 by the reprex package (v0.3.0)