Do you mean something like this?
library(ggplot2)
library(dplyr)
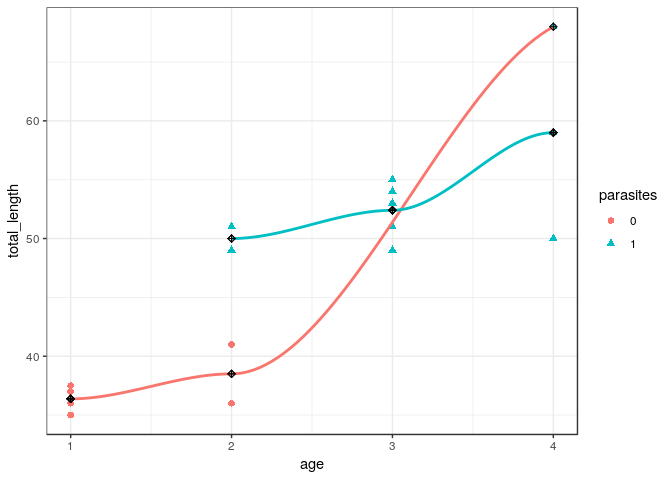
df %>%
mutate(parasites = as.factor(parasites)) %>%
group_by(parasites, age) %>%
mutate(mean_length = mean(total_length)) %>%
arrange(parasites, age) %>%
ggplot(aes(x = age, y = total_length, shape = parasites, color = parasites)) +
geom_point(size = 2) +
geom_smooth(aes(y = mean_length), method = "loess", show.legend = FALSE) +
geom_point(aes(y = mean_length), shape = 9, show.legend = FALSE, color = "black") +
theme_bw()