library(tidyverse)
set.seed(42)
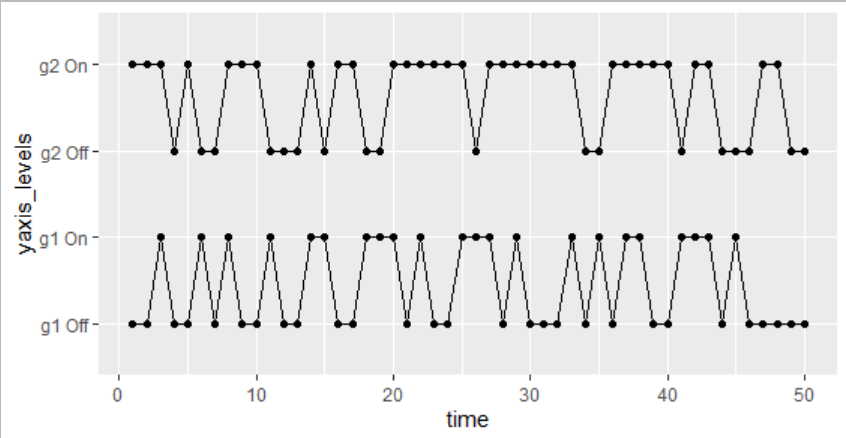
df <- data.frame(
g1 = rbinom(n = 50, size = 1, prob = 0.60),
g2 = rbinom(n = 50, size = 1, prob = 0.60),
time = 1:50) %>% pivot_longer(cols = starts_with("g"),
names_to = "g",
values_to = "height") %>%
mutate(heightswitch=case_when(height==0 ~ "Off",
TRUE ~ "On"),
yaxis_levels = factor(paste0(g," ",heightswitch)))
ggplot(df, aes(x=time,y= yaxis_levels,group=g)) +
geom_point() + geom_line()
1 Like