See the FAQ: How to do a minimal reproducible example reprex for beginners for how to illustrate a problem in a way that is reproducible. You just need representative data, as shown below with a built-in dataset.
suppressPackageStartupMessages({
library(ggplot2)
})
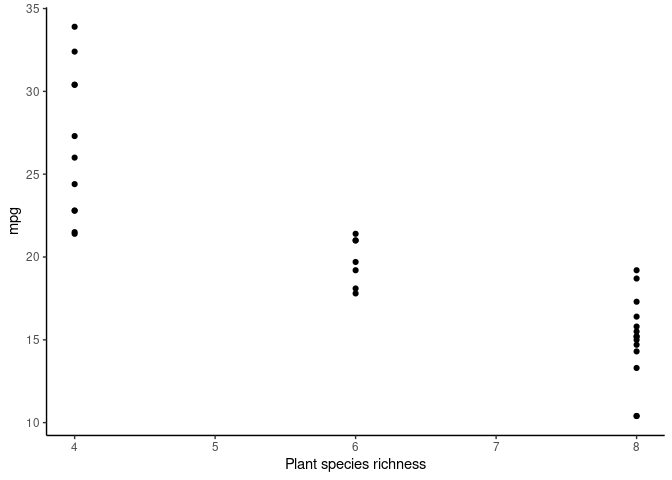
ggplot(data = mtcars,aes(x = cyl, y = mpg)) + # trailing comma is unnecessary
geom_point() +
xlab("Plant species richness") + # generally better to put theme last
# theme_base() # there is no theme_base in the ggplot2 package
theme_classic() # this is the theme that reproduces the problem
Try theme_minimal, which eliminates the border. Come back with a separate question if you also want "How to eliminate grid lines from ggplot?"