Leaflet proxy is helpful when you have to redraw the same (or almost the same map). I don't think it would help much when the speed of the first render is the issue.
I would rather start by questioning your need for 5500 polygons (it is a lot). Could you plot your data per state? Or, if overview of entire country is necessary, could you possibly replace the polygons by their centroids? Plotting 5500 points is, relatively speaking, a breeze...
library(leaflet)
library(tictoc)
library(sf)
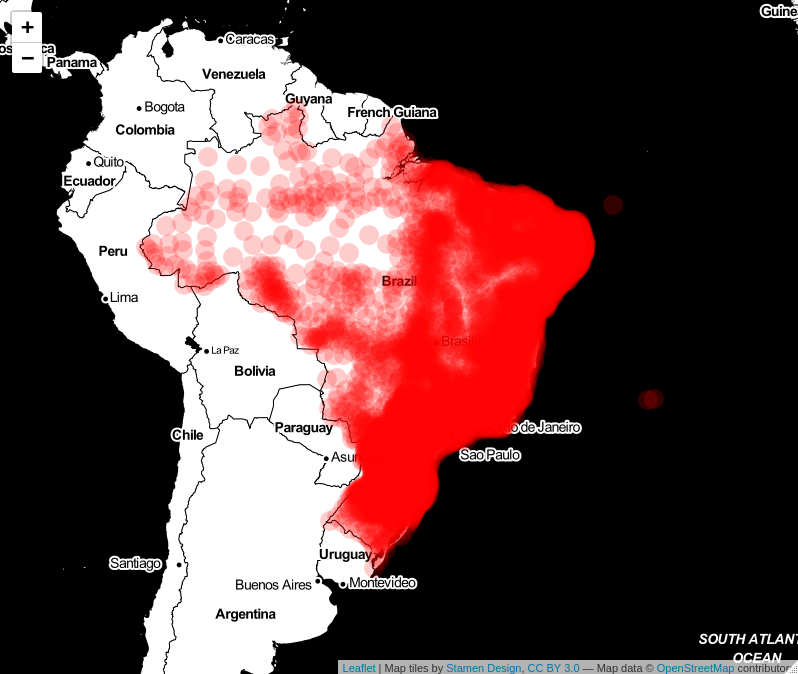
borders <- readRDS(url("https://biogeo.ucdavis.edu/data/gadm3.6/Rsf/gadm36_BRA_2_sf.rds"))
points <- st_centroid(borders)
tictoc::tic()
leaflet(data = points) %>%
addProviderTiles("Stamen.Toner") %>%
addCircleMarkers(fillColor = "red",
stroke = F)
tictoc::toc()
0.076 sec elapsed
The difference between points and polygons in this level of detail seems small, but the speed of rendering improved by several orders of magnitude.