Hi,
Welcome to the RStudio community!
Next time when you make a post, try to create a reprex, that way it'll be more likely that folk will answer your question ![]() A reprex consists of the minimal code and data needed to recreate the issue/question you're having. You can find instructions how to build and share one here:
A reprex consists of the minimal code and data needed to recreate the issue/question you're having. You can find instructions how to build and share one here:
In this case I used a dataset that comes with the seewave package to showcase the solution (which I hope is the solution you are looking for)
library(tuneR)
library(seewave)
library(dplyr)
#Get some data
data(tico)
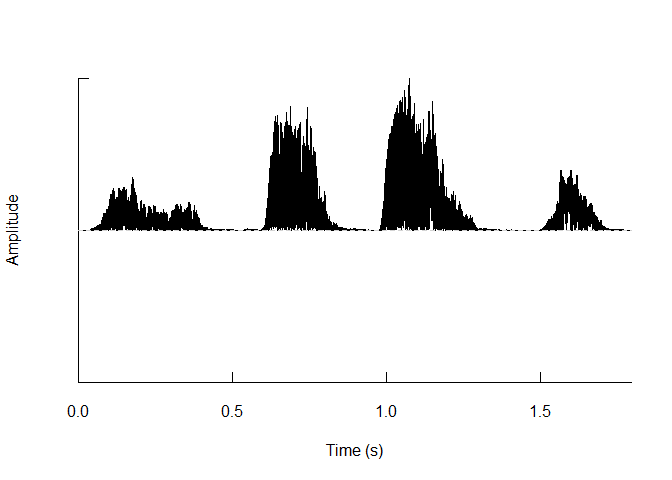
#Full data plot
env(tico, f= 22050, channel = 1, envt = "abs",
msmooth = NULL, ksmooth = NULL, ssmooth = NULL,
asmooth = NULL,
fftw = FALSE, norm = FALSE,
plot = TRUE, k = 1, j = 1)
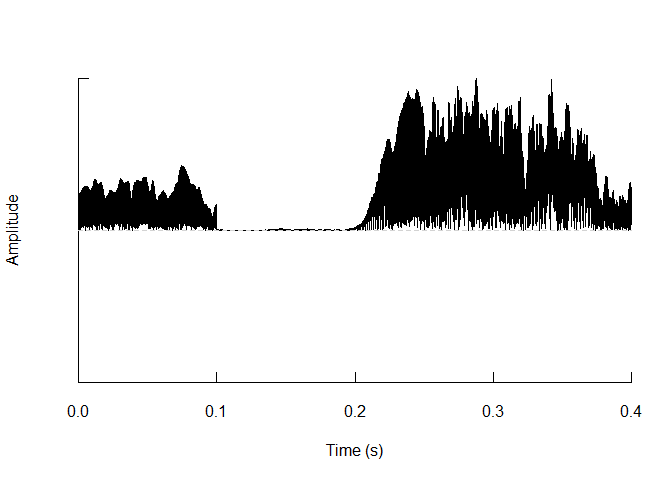
#Set the cuts
cuts = data.frame(
  from = c(0.1, 0.5),
  to = c(0.2, 0.8)
)

#Paste the cuts together and plot
data = apply(cuts, 1, function(cut){
  tico %>%
    cutw(f=22050, from = cut[1], to = cut[2], choose = FALSE,
         plot = FALSE, marks = FALSE, output="wave")
}, simplify = F) %>% do.call(rbind, .) %>%
  env(., f= 22050, channel = 1, envt = "abs",
      msmooth = NULL, ksmooth = NULL, ssmooth = NULL,
      asmooth = NULL,
      fftw = FALSE, norm = FALSE,
      plot = TRUE, k = 1, j = 1)
Created on 2022-03-10 by the reprex package (v2.0.1.9000)
Hope this helps,
PJ