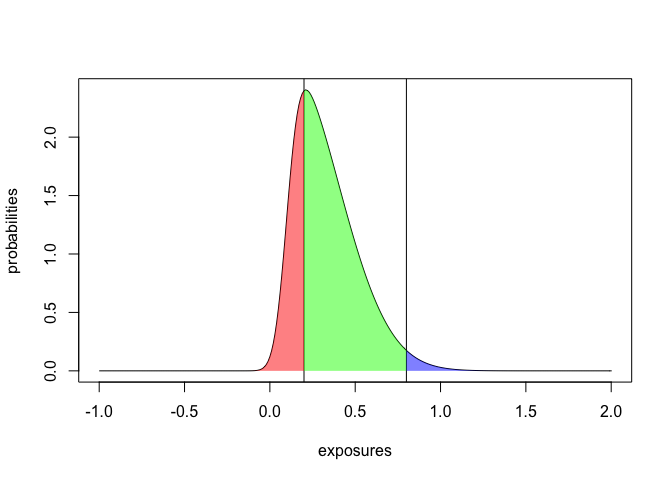
This is a general solution to shade below a point, above a point and in between two points. I have intentionally didn't use mean and quantile so that you can do that yourself. Hope this helps.
# loading library
library(sn)
#> Loading required package: stats4
#>
#> Attaching package: 'sn'
#> The following object is masked from 'package:stats':
#>
#>     sd

# generating data
exposures <- seq(from = -1,
                 to = 2,
                 by = 0.01)
probabilities <- dsn(x = exposures,
                     xi = 0.1,
                     omega = 0.3,
                     alpha = 5)

# calculating measures
measures <- quantile(x = exposures,
                     probs = c(0.40, 0.60))

# plotting distribution
plot(x = exposures,
     y = probabilities,
     type = "l")

# adding vertical lines at selected measures
abline(v = c(measures[1], measures[2]))

# shading areas below arithmetic mean, above upper 0.01 point and in between
polygon(x = c(min(exposures), exposures[exposures <= measures[1]], measures[1]),
        y = c(0, probabilities[exposures <= measures[1]], 0),
        border = NA,
        col = adjustcolor(col = "red",
                          alpha.f = 0.5))
polygon(x = c(measures[1], exposures[(exposures >= measures[1]) & (exposures <= measures[2])], measures[2]),
        y = c(0, probabilities[(exposures >= measures[1]) & (exposures <= measures[2])], 0),
        border = NA,
        col = adjustcolor(col = "green",
                          alpha.f = 0.5))
polygon(x = c(measures[2], exposures[exposures >= measures[2]], max(exposures)),
        y = c(0, probabilities[exposures >= measures[2]], 0),
        border = NA,
        col = adjustcolor(col = "blue",
                          alpha.f = 0.5))
Created on 2020-04-11 by the reprex package (v0.3.0)