For my introduction course we are introduced to R studio and are tasked with creating scatter plots and were given code to put in exaime the outputs. However the below was entered and i receive an error. i can't figure out what has happened it worked in the book. Please advise.
lines(c(0,10),c(12,0),lty=2)
Error in plot.xy(xy.coords(x, y), type = type, ...) :
  plot.new has not been called yet
and
> y=a+bx
Error: object 'a' not found
> abline(lm(y~x))
Error in int_abline(a = a, b = b, h = h, v = v, untf = untf, ...) :
  plot.new has not been called yet
1 Like
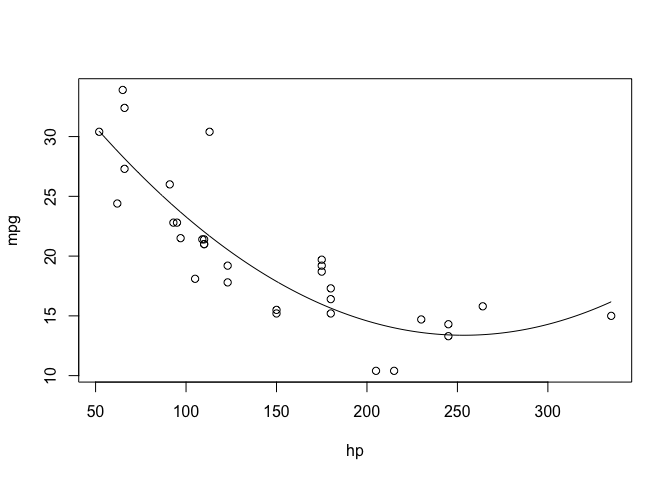
In base plotting, you start a plot by calling plot or a similar command which generates a plot, which you can then add to with functions like lines. For example, to plot a polynomial regression of mtcars,
model <- lm(mpg ~ poly(hp, 2), mtcars)    # make a model
domain <- seq(min(mtcars$hp), max(mtcars$hp))    # define a vector of x values to feed into model

plot(mpg ~ hp, mtcars)    # plot points
lines(domain, predict(model, newdata = data.frame(hp = domain)))    # add regression line, using `predict` to generate y-values
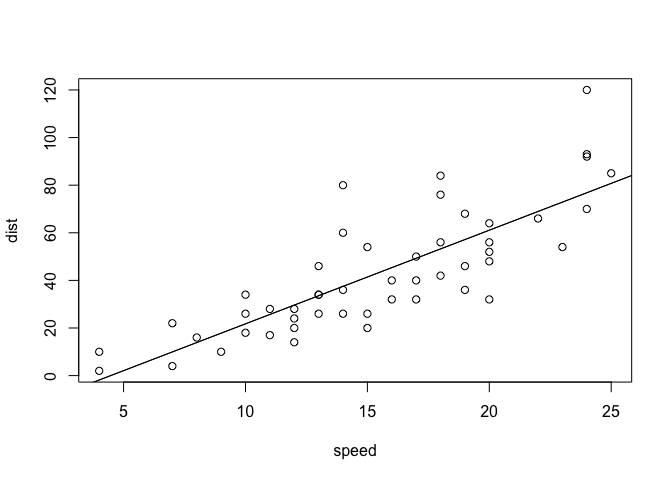
abline is a simplified version of lines that only plots straight lines, and which has a method for plotting simple lm objects.
For example, in the examples at the bottom of ?abline,
z <- lm(dist ~ speed, data = cars)
plot(cars)
abline(z) # equivalent to abline(reg = z) or
abline(coef = coef(z))
If you don't want plot to plot anything, you can call it with enough information to set the axes properly and type = "n" to plot nothing.
2 Likes