Here's an example using the built-in mtcars dataset. See the FAQ: How to do a minimal reproducible example reprex for beginners for how to attract answers specific to your data.
library(ggplot2)
# first create an empty base plot
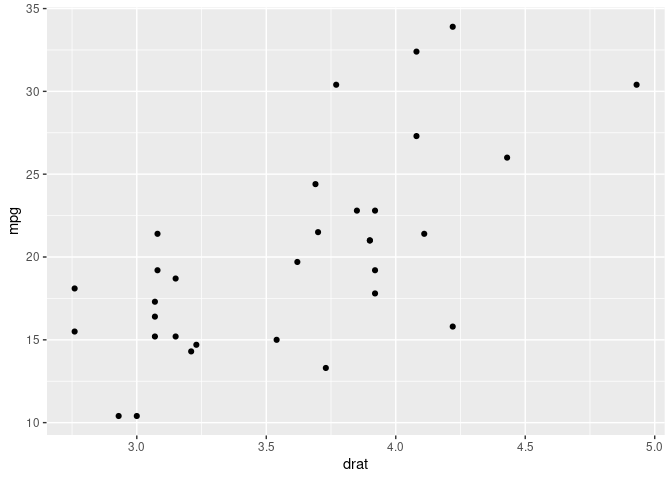
p <- ggplot(mtcars,aes(drat,mpg))
# then add the points aesthetic
p + geom_point()
# again, with color of points
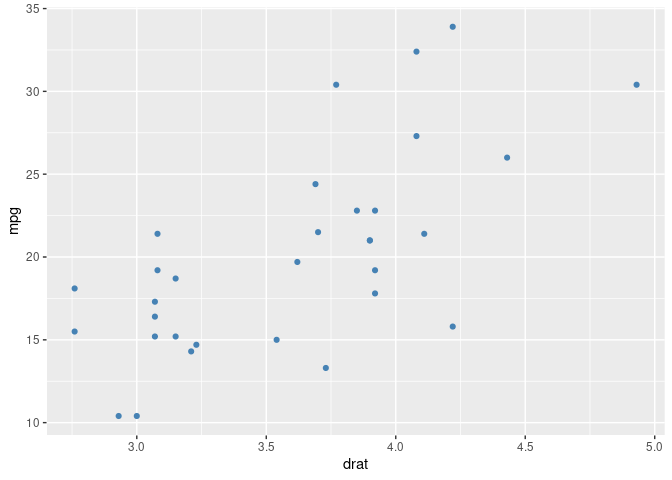
p + geom_point(color = "steelblue")
# now add the regression line
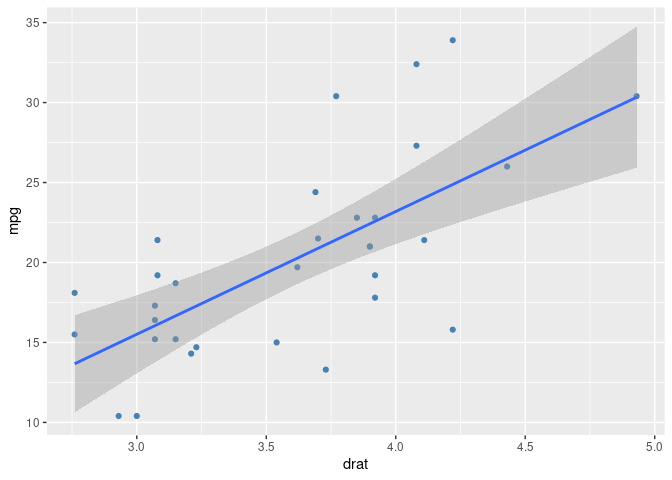
p + geom_point(color = "steelblue") + geom_smooth(method = "lm")
#> `geom_smooth()` using formula 'y ~ x'
# now add the plot and axes titles
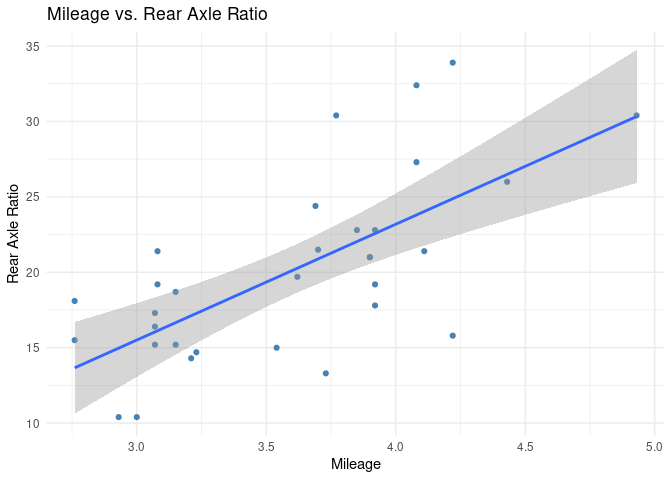
p +
geom_point(color = "steelblue") +
geom_smooth(method = "lm") +
labs(title = "Mileage vs. Rear Axle Ratio") +
xlab("Mileage") +
ylab("Rear Axle Ratio") +
theme_minimal()
#> `geom_smooth()` using formula 'y ~ x'
Created on 2022-01-21 by the reprex package (v2.0.1)