Is this what you mean?
library(tidyverse)
link <- "https://drive.google.com/uc?export=download&id=1UeVTJ1M_eKQDNtvyUHRB77VDpSF1ASli"
download.file(url = link, destfile = "Antisocial.csv")
Antisocial <- read.csv(file = 'Antisocial.csv')
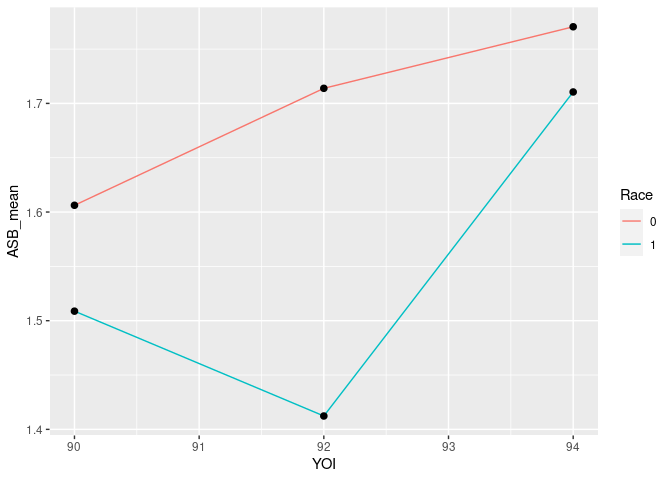
Antisocial %>%
mutate(Race = factor(Race)) %>%
group_by(Race, YOI) %>%
summarise(ASB_mean = mean(ASB)) %>%
ggplot(aes(x = YOI, y = ASB_mean)) +
geom_line(aes(color = Race, group = Race)) +
geom_point(size = 2)
#> `summarise()` has grouped output by 'Race'. You can override using the `.groups` argument.
Created on 2021-04-18 by the reprex package (v2.0.0)
If this doesn't solve your problem, please provide a proper REPRoducible EXample (reprex) illustrating your issue.