Yes, that is exactly why. scale_x_date() can only be used with date variables and you have a character variable instead, please see this example:
library(tidyverse)
sample_df <- data.frame(
stringsAsFactors = FALSE,
date = c("1992-1","1992-1","1992-1",
"1992-2","1992-2","1992-2"),
ratio = c(0.5, 0.6, 0.5, 0.7, 0.65, 0.65)
)
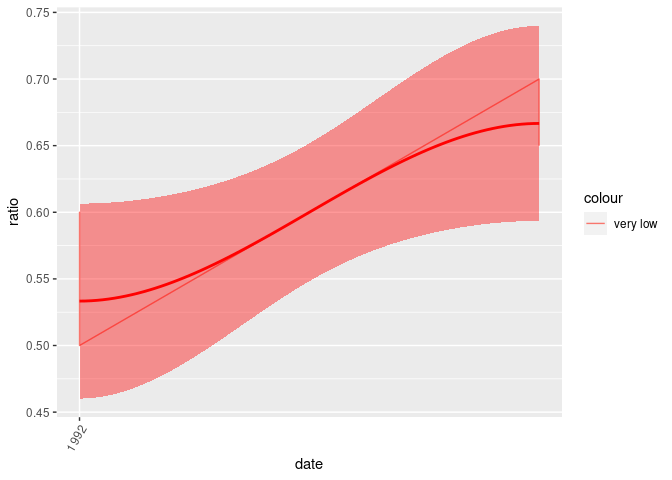
sample_df %>%
mutate(date = as.Date(paste0(date, "-1"))) %>%
ggplot(aes(x = date, y = ratio)) +
geom_line(aes(group = 1, colour="very low")) +
geom_smooth(method = loess, fill = "red", colour = "red", size = 1) +
scale_x_date(date_breaks = "1 year", date_labels = "%Y") +
theme(axis.text.x = element_text(angle = 60, hjust = 1))
Created on 2021-02-18 by the reprex package (v1.0.0)
Note: Next time please provide a proper REPRoducible EXample (reprex) illustrating your issue.