Hi @Asteinza. To manually specify colors in ggplot, you need to specify the variable of interest within aes(). Below is an illustration with geom_bar.
library(tidyverse)
# set cyl to character for example
mtcars$cyl = as.character(mtcars$cyl)
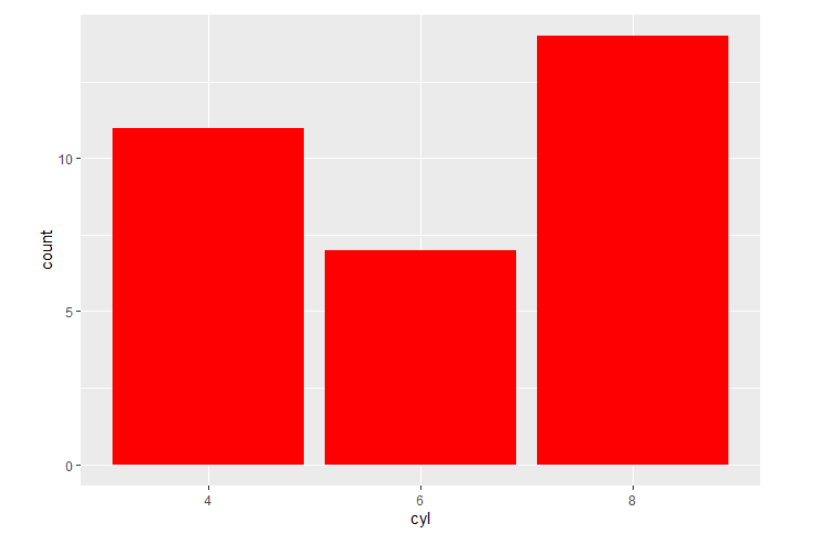
# fill specified outside of aes() - all same color
ggplot(mtcars, aes(x=cyl)) +
geom_bar(fill='red')
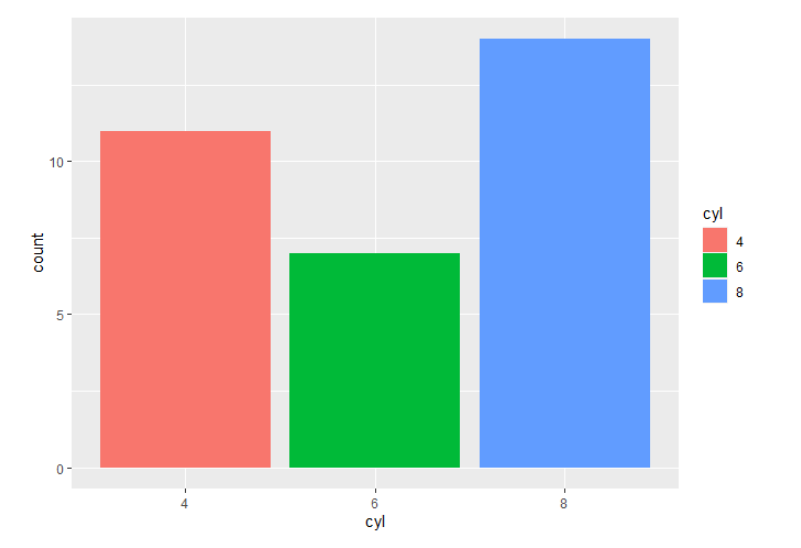
# fill specified within aes - different color for each value of cyl
ggplot(mtcars, aes(x=cyl)) +
  geom_bar(aes(fill=cyl))
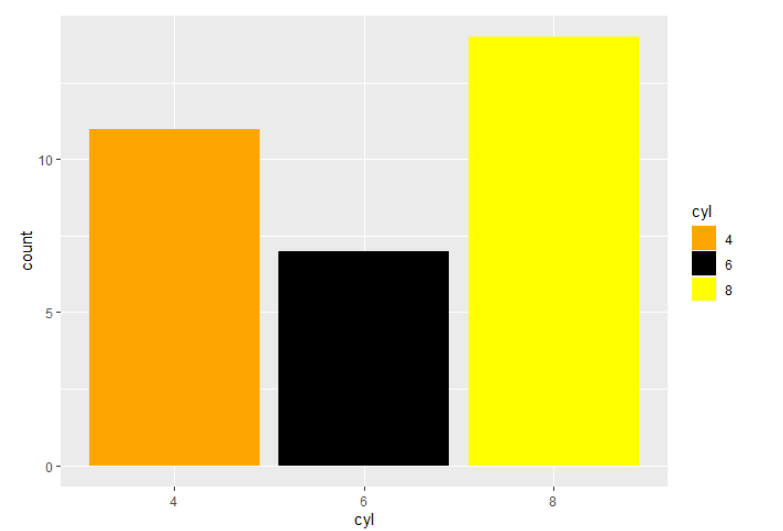
# fill specified within aes and colors of cyl set manually
ggplot(mtcars, aes(x=cyl)) +
  geom_bar(aes(fill=cyl)) +
  scale_fill_manual(values = c('orange', 'black', 'yellow'))