Do a reprex. See the FAQ like the one below using your data in place of the fake version?
library(caret)
#> Loading required package: ggplot2
#> Loading required package: lattice
set.seed(42)
bucket <- sample(seq(0, 600, 0.1), 110)
pV <- data.frame(
x1 = bucket[1:10],
x2 = bucket[11:20],
x3 = bucket[21:30],
x4 = bucket[31:40],
x5 = bucket[41:50],
x6 = bucket[51:60],
x7 = bucket[61:70],
x8 = bucket[71:80],
x9 = bucket[81:90],
x10 = bucket[91:100],
x11 = bucket[101:110]
)
range(pV$x5)
#> [1] 62.5 435.7
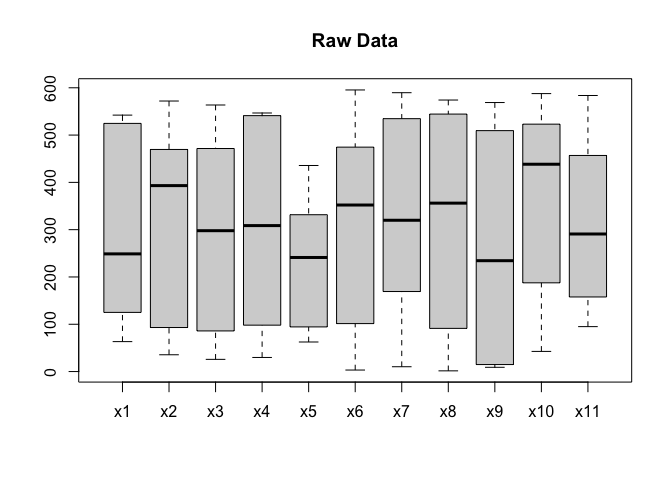
boxplot(pV,main="Raw Data")
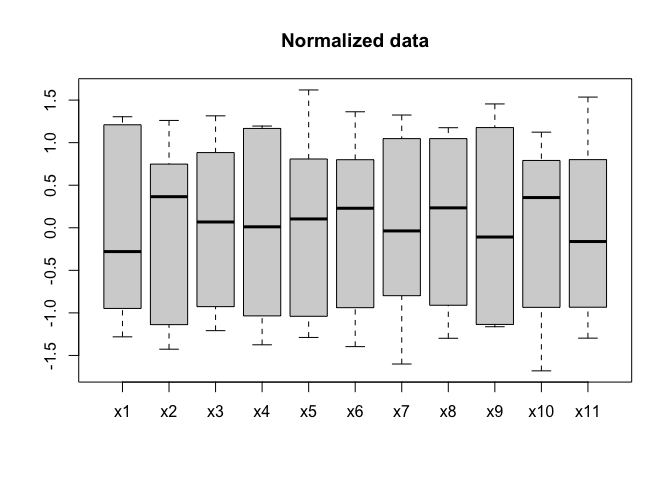
preObj <- preProcess(pV, method = c("center", "scale"))
preObjData <- predict(preObj,pV)
boxplot(preObjData, main="Normalized data" )
Created on 2023-01-30 with reprex v2.0.2